Artemis Global Income Fund
Q3 2026 update


Source for all information: Artemis as at 30 September 2026, unless otherwise stated.
Summary
• In a volatile quarter, the fund outperformed the index and its peer group
• It remains underweight in technology and tilted towards more modestly valued sectors
• As borrowing costs rose and uncertainty increased, we added to the fund’s more defensive ‘core’ holdings
Overview
The third quarter saw a number of competing narratives pulling in different directions. The result was elevated volatility, both across asset classes and on an individual stock level. On one side, the AI super-cycle continued – the hyperscalers are expected to invest $800bn in building AI infrastructure in 2026. That extraordinary wave of investment is driving growth in corporate earnings, especially in parts of the technology sector. It is also helping to drive economic growth in the US and technology-intensive Asian economies, with survey data pointing to an acceleration rather than a slow-down.
On the other side, renewed hostilities in the Middle East pushed oil prices higher, feeding inflation and pushing government bond yields to multi-decade highs. The US Federal Reserve responded by voting to raise interest rates for the first time in three years. Above-target inflation and the expansionary fiscal policies of the US administration mean monetary policy needed to tighten. But given that supply-side bottlenecks appear to be pushing prices higher, we are not convinced that higher rates will do much to bring inflation down.
Against this volatile backdrop, the fund returned 1.9% in sterling terms, marginally outperforming the MSCI AC World index (ACWI), which returned 1.5%. Its margin of outperformance relative to the IA's Global Equity Income peer group, where the average return was 1.0%, was slightly wider.
Performance
| Three months | Year to date | One year | Three years | Five years | |
|---|---|---|---|---|---|
| Artemis Global Income | 1.9% | 22.9% | 31.0% | 135.7% | 161.0% |
| MSCI AC World NR | 1.5% | 14.4% | 18.3% | 65.7% | 75.5% |
| IA Global Equity Income average | 1.0% | 11.0% | 15.3% | 46.5% | 59.6% |
Past performance is not a guide to the future. Source: Lipper Limited to 30 September 2026 for class I Inc GBP. All figures show total returns with dividends and/or income reinvested, net of all charges. Performance does not take account of any costs incurred when investors buy or sell the fund. Returns may vary as a result of currency fluctuations if the investor’s currency is different to that of the class. This class may have charges or a hedging approach different from those in the IA sector benchmark.
Although the fund’s relative performance was positive over the quarter, it was volatile. In broad terms, it underperformed in July, outperformed significantly in August and then underperformed in September, when strong returns from a number of the Magnificent Seven stocks drove markets higher.
The fund’s biggest sector overweight against the benchmark is in banks. Around 27% of the fund is invested in this part of the market versus 8% of the index. This contributed to its outperformance over the quarter, with European banks such as Banco de Sabadell and National Bank of Greece among its top 10 contributors. In the second quarter, the earnings of European banks were 18% higher than in the same period a year ago. UK-listed, Asia-focused Standard Chartered also performed well, driven by strong growth in its wealth solutions division.
In broad terms, higher interest rates have remained supportive of the banks’ profitability. Their balance sheets are generally strong and we believe the combination of share buybacks and dividend payments continues to look attractive.
Conversely, our overweight in industrials (where almost 13% of the fund is invested versus 10% of the MSCI ACWI) weighed on relative returns. Siemens Energy (gas turbines) and Prysmian (high-voltage and fibre-optic cables) are two companies whose earnings have benefited from the investment in building data centres over the last three years. Both made significant contributions to the fund’s returns. But as the market begins to question how much longer this remarkable capex boom can last – and how much of the good news has already been priced in – the ‘picks and shovels’ story may have less room to run.
Positive contributors
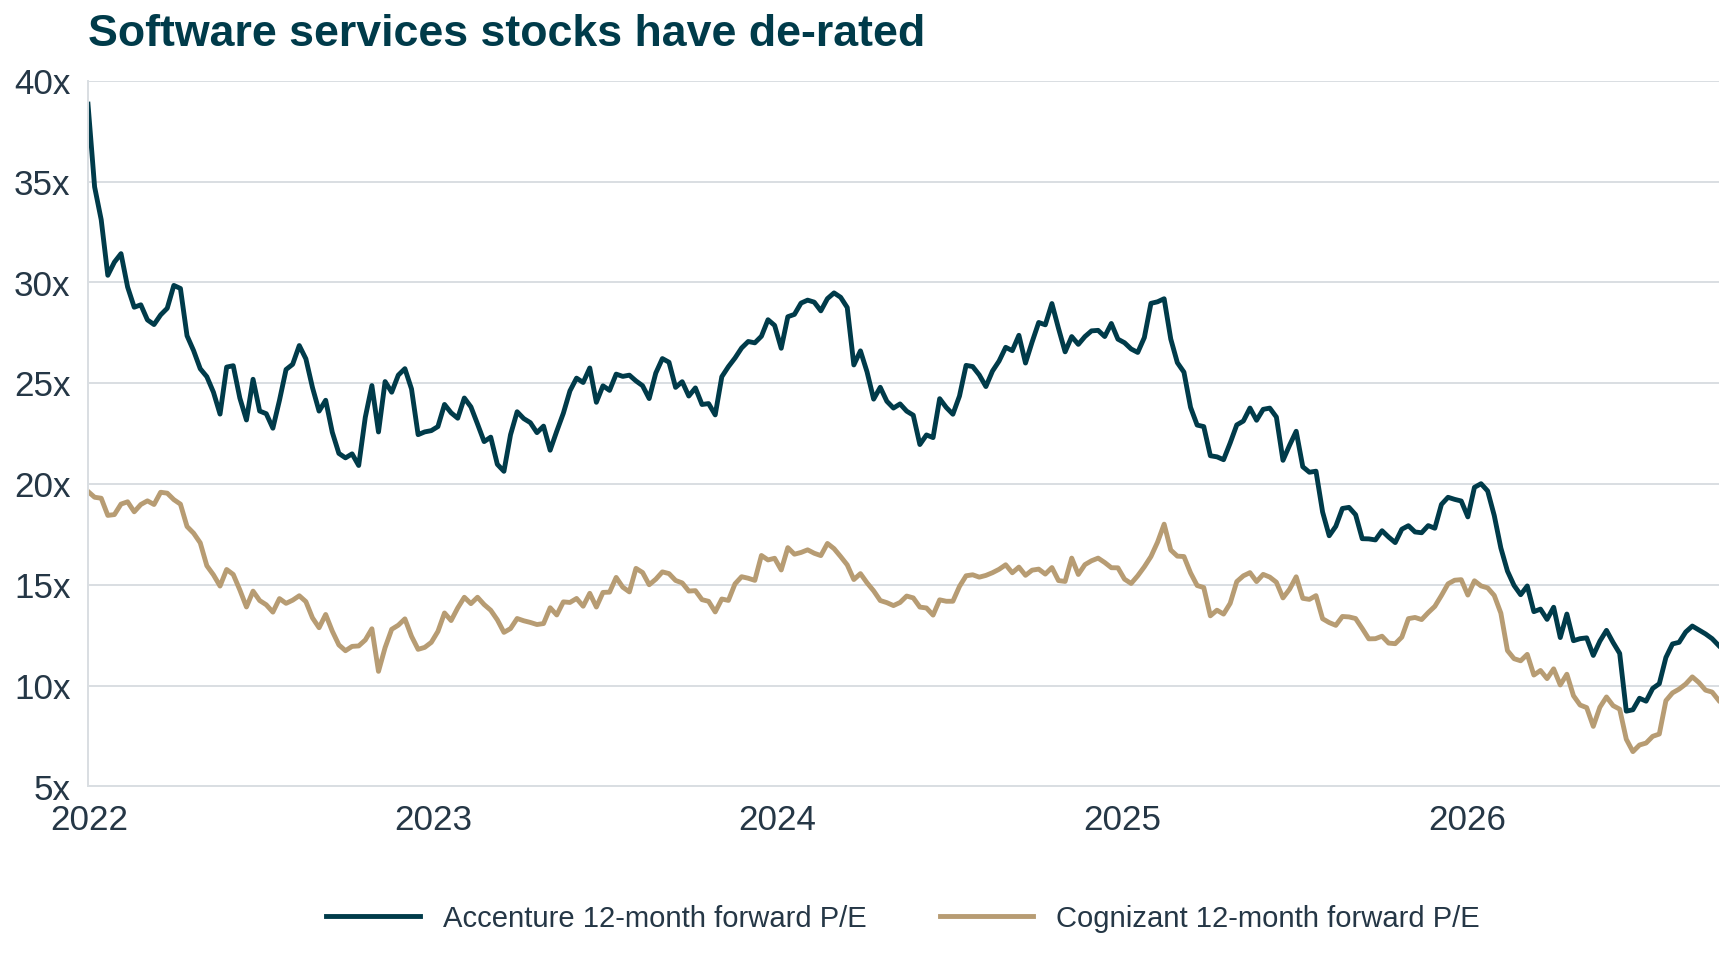
Over the last 12-to-18 months, shares in software services providers Accenture and Cognizant have de-rated as investors grew concerned that AI would disrupt the IT services industry. In both cases, we thought those concerns were overdone and, as the market's view moved closer to ours, both companies rallied from their lows.
Even after those rallies, we believe these holdings remain attractively valued relative to their history. Both currently offer free cash-flow yields of around 10% and could benefit from the considerable investment that will be required if AI is to be implemented across large organisations. As the quarter was ending, Accenture’s full-year results showed “growth across all geographic markets, industry groups and types of work”, alongside strong growth in its earnings, free cash flows and profitability.
Source: Bloomberg as at 16 October
In July, Norwegian oil & gas producer Vår Energi announced it was acquiring BlueNord, a smaller gas producer operating in Denmark's area of the North Sea. This deal added to Vår's proven reserves and enhanced its free cash flow. The shares it issued to finance part of the transaction will increase its free float, potentially making it more attractive to a wider pool of investors. Vår's shares currently yield 9% and, if this is sustainable (and we believe it is), it represents a good starting point even before considering the potential for its earnings or dividend to grow in the next 12-to-24 months.
Korean defence company Hanwha Aerospace outperformed. The fund's holdings in this sector have delivered strong returns over the past five years. At one point, holdings in defence-related companies such as Rheinmetall and Mitsubishi Heavy Industries accounted for around 20% of the portfolio. As those companies' shares steadily re-rated, we reduced the fund's exposure to the sector, taking it down to less than 5%. The sector remains interesting but we are conscious that political considerations are at work here. The defence companies' largest customers are governments and they must confront the fact that their borrowing costs have increased and that their fiscal positions have become constrained.
Hanwha is now our largest position in this area. Its shares trade on about 20x forward earnings, significantly below those of its European peers. Its earnings in the second quarter rose by 59% year on year as exports – including to European markets such as Poland – grew. We continue to think its relatively low valuation, combined with robust demand, offers an attractive balance of risk and reward.
Negative contributors
Some of the fund's investments in the beneficiaries of AI-related capital expenditure underperformed through the quarter. These included Prysmian and Siemens Energy, along with other areas of the AI supply chain, such as Samsung Electronics.
Other Korean holdings, such as Samsung Life and SK Inc, also sold off. We have reduced the fund's allocation to the volatile Korean market, which has become the epicentre of investors' uncertainty as to the durability of the AI capex boom.
The outperformance of the Magnificent Seven stocks the fund doesn’t own – including Nvidia, Apple and Meta – weighed on relative returns. As a reminder, the fund has had a structural underweight to these companies for more than a decade, reflecting their high valuations and low yields. When markets are as concentrated as they are today (those seven stocks account for over 20% of the global index), strong performance in areas we do not own can be painful. But we will not abandon our discipline on free cash flows and valuations.
Activity and positioning
We group the fund’s holdings into three buckets:
Risk – Often with a significant value bias, these are companies with high, opportunistic dividend yields, high beta and, in some cases, above-average financial gearing.
Growth – Often cyclical companies with above-market dividend yields, dividend growth and average payout ratios.
Core – Mature companies with high and stable dividend yields and high payout ratios, but relatively low dividend growth.
It is not inconceivable that the rise in short- and long-term borrowing costs will begin to suck liquidity away from risk assets. Given that view, we added to the fund's core bucket during the quarter, taking our allocation up from 20% to just under 30% by the time it ended.
In other respects, the shape of the portfolio did not change materially. It remains overweight in financials, particularly in European banks. It also has investments across a range of ‘old economy’, asset-intensive industries such as energy and mining.
Set against that, the fund has a structural underweight to technology. This reflects the fact that these companies tend to lack meaningful dividends, generate below-average free cash-flow yields and, in some cases, trade on high valuation multiples. At the end of the quarter, around 17% of the portfolio was invested in technology versus 33% of the MSCI ACWI.
Viewed from the top down, we believe the fund is attractively positioned relative to the index, not only in terms of its valuation and free cash-flow yield, but also in terms of its underlying earnings growth.
| Characteristics as at 01/10/2026 | Artemis Global Income | MSCI ACWI | The fund compared with the index |
|---|---|---|---|
| Price-to-earnings multiple | 12.9x | 20.7x | A significant valuation discount |
| Dividend yield | 3.7% | 1.8% | Roughly double the dividend yield |
| Free cash flow yield | 10.0% | 5.8% | Payouts well covered by cash flows |
| Return on equity | 14.1% | 14.6% | Similar returns on equity |
| Return on invested capital | 10.0% | 9.7% | Similar returns on invested capital |
| Median dividend growth | 9.1% | 7.3% | Faster growth in dividends |
| Median earnings per share growth | 14.6% | 11.5% | Faster growth in earnings |
Source: Artemis as at 30 September 2026
Outlook
The debate in markets is clear but not simple. The US is running a fiscal deficit of over 8% and 30-year mortgage rates are above 7%. Oil prices, meanwhile, have moved back above $100 per barrel and risk-free rates across most regions of the global economy are hitting multi-decade highs. None of these would seem to be helpful for equities.
Yet stock markets have delivered strong returns so far in 2026 and corporate earnings are growing at their fastest pace in several years, helped by the AI capex super-cycle. At the same time, we are conscious that market leadership and returns have become narrower.
With the shorter-term cyclical outlook remaining unclear, we continue to refer to our 'regime change' roadmap to understand the longer-term forces shaping markets. Government finances continue to deteriorate. Inflation has been a recurring problem across much of the developed world since the pandemic, repeatedly proving more persistent than policymakers expected. A volatile geopolitical backdrop, meanwhile, is forcing governments to invest in self-sufficiency and security. A long period of underinvestment in essential infrastructure, particularly in the energy sector, still needs to be corrected.
Although the areas of the market in which we find our investment ideas continue to evolve, the broad characteristics of the portfolio remain the same:
- It is genuinely global, with holdings across 24 countries and 13 currencies
- It has a significantly lower weighting to the US and technology stocks than market-cap-weighted indices
- It continues to trade at a significant valuation discount to the index, while paying a substantially higher dividend yield
The result is a fund whose portfolio – and pattern of returns – looks quite different from the index and most of its peers.
FOR PROFESSIONAL INVESTORS AND/OR QUALIFIED INVESTORS AND/OR FINANCIAL INTERMEDIARIES ONLY. NOT FOR USE WITH OR BY PRIVATE INVESTORS.
CAPITAL AT RISK. All financial investments involve taking risk and the value of your investment may go down as well as up. This means your investment is not guaranteed and you may not get back as much as you put in. Any income from the investment is also likely to vary and cannot be guaranteed.
This is a marketing communication. Before making any final investment decisions, and to understand the investment risks involved, refer to the fund prospectus (or in the case of investment trusts, Investor Disclosure Document and Articles of Association), available in English, and KIID/KID, available in English and in your local language depending on local country registration, available in the literature library.
Risks specific to Artemis Global Income Fund
- Market volatility risk The value of the fund and any income from it can fall or rise because of movements in stockmarkets, currencies and interest rates, each of which can move irrationally and be affected unpredictably by diverse factors, including political and economic events.
- Currency risk The fund’s assets may be priced in currencies other than the fund base currency. Changes in currency exchange rates can therefore affect the fund's value.
- Charges from capital risk Where charges are taken wholly or partly out of a fund's capital, distributable income may be increased at the expense of capital, which may constrain or erode capital growth.
- Emerging markets risk Compared to more established economies, investments in emerging markets may be subject to greater volatility due to differences in generally accepted accounting principles, less governed standards or from economic or political instability. Under certain market conditions assets may be difficult to sell.
- Income risk The payment of income and its level is not guaranteed.
Important information
The intention of Artemis’ ‘investment insights’ articles is to present objective news, information, data and guidance on finance topics drawn from a diverse collection of sources. Content is not intended to provide tax, legal, insurance or investment advice and should not be construed as an offer to sell, a solicitation of an offer to buy, or a recommendation for any security or investment by Artemis or any third-party. Potential investors should consider the need for independent financial advice. Any research or analysis has been procured by Artemis for its own use and may be acted on in that connection. The contents of articles are based on sources of information believed to be reliable; however, save to the extent required by applicable law or regulations, no guarantee, warranty or representation is given as to its accuracy or completeness. Any forward-looking statements are based on Artemis’ current opinions, expectations and projections. Articles are provided to you only incidentally, and any opinions expressed are subject to change without notice. The source for all data is Artemis, unless stated otherwise. The value of an investment, and any income from it, can fall as well as rise as a result of market and currency fluctuations and you may not get back the amount originally invested.