Artemis SmartGARP UK Equity Fund
Q2 2026 update

Source for all information: Artemis as at 29 June 2026, unless otherwise stated.
There was much to discuss during Q2 2026 in the UK: the collapse of Keir Starmer's leadership, the rise of Andy Burnham, the Middle East conflict, the World Cup… the list goes on. The question one must ask is: does any of it matter? Many investors will tell you that it absolutely does and the changing backdrop warrants close attention from both an opportunity and a risk standpoint. We are inclined not to be too absolutist; there is nuance to every investment rule, but in general we believe that focusing too much on short-term narratives will serve investors poorly over the long term. Little is known about Burnham and his plans and even less is known about what Donald Trump might say next, so why bet the house on it?
This belief sounds like it could land us in trouble, but evidence suggests that, over the long term, it does not. One has to be comfortable with the imperfect nature of investing. After all, a fantastic fund manager still has to contend with a high proportion of their decisions turning out to be wrong.
So, what allows us to weather global disruptions and domestic political upheaval? It is focusing on what the evidence shows really matters: the fundamental growth of a company and the income it delivers. We combine this longer-term view with some sensible portfolio construction guidelines to ensure we are diversified across sector, company and factor.
Since we started to collect data on the fund in 2003, the earnings of its holdings have compounded by 2.7 percentage points per annum faster than those of the FTSE All-Share. In share price terms, its holdings have outperformed the index by 2.2 percentage points per annum. Relative to the US, the fund's holdings have delivered the same earnings growth but they have derated at a pace of 1.5% per annum, leaving our fund trading on half that market's p/e multiple. At some point, one would expect this valuation gap to narrow.
Artemis SmartGARP UK Equity vs MSCI USA index
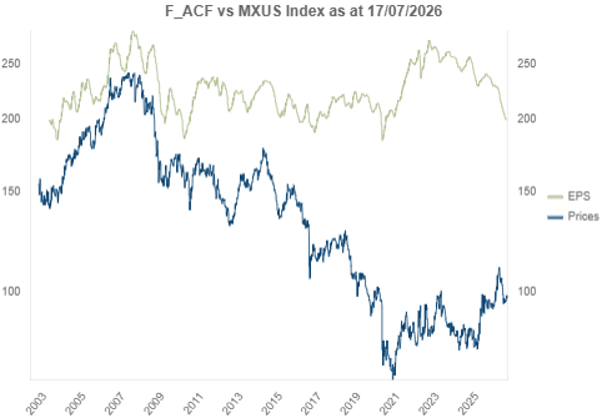
Green line: Artemis SmartGARP UK Equity Fund, earnings per share relative to US equities/Blue line: Artemis SmartGARP UK Equity Fund, total return relative to US equities/Source: Artemis LSEG Datastream 1 January 2003 to 17 July 2026
Performance
It was encouraging to see the fund outperform during the quarter, returning 8.0% compared with 4.7% from its FTSE All-Share benchmark. Year-to-date it is up 8.3% compared with 7.2% from the index.
| Three months | Six months | One year | Three years | Five years | |
|---|---|---|---|---|---|
| Artemis SmartGARP UK Equity Fund | 8.0% | 8.3% | 29.6% | 97.3% | 126.6% |
| FTSE All-Share TR | 4.7% | 7.2% | 21.9% | 53.1% | 67.9% |
| IA UK All Companies average | 7.2% | 5.0% | 12.2% | 37.0% | 32.6% |
Past performance is not a guide to the future. Source: Lipper Limited/Artemis to 30 June 2026 for class I accumulation GBP. All figures show total returns with dividends and/or income reinvested, net of all charges. Performance does not take account of any costs incurred when investors buy or sell the fund. Returns may vary as a result of currency fluctuations if the investor's currency is different to that of the class. Classes may have charges or a hedging approach different from those in the IA sector benchmark.
Contributors/detractors
From a sector standpoint, the most significant contribution came from our financials exposure, which added 3.4 percentage points to relative returns. The broader sector was up 16.0% (rewarding our overweight) while our total exposure delivered 21.2%, indicating strong stockpicking skill. It wasn’t just banks, with financial services and insurance also doing well. Individual names of note included Lion Finance, IG Group, Lloyds, Man Group and NatWest.
Outside of financials, our underweight in AstraZeneca and BAE Systems (which we don't own) contributed.
On the detracting side, an underweight in Rolls-Royce hurt from a relative point of view, as did our oil & gas names (such as Repsol, BP and Eni).
At a factor level, growth, heavily traded and volatile stocks performed best, with the least volatile and smaller market-cap stocks performing poorly.
| Style | Q2 |
|---|---|
| Growth | 1.6% |
| Trade activity | 1.4% |
| Value | 1.3% |
| Share buybacks | 1.1% |
| Dividends | (1.5%) |
| Quality | (2.0%) |
| Momentum | (2.6%) |
| Revisions | (2.6%) |
| ESG | (3.3%) |
| Size | (4.9%) |
| Volatility | (6.8%) |
Source: Bloomberg. Index: FTSE 350 Q2 2026 factor performance. Top quintile active return
Activity and positioning
In terms of adjustments, below are our sector weightings, along with the three-month change in relative positioning.
| Sector | Fund (%) | Index (%) | Relative (%) | 3-month change (%) |
|---|---|---|---|---|
| Banks | 28.5 | 17.9 | 10.6 | 1.4 |
| Financial services | 13.0 | 6.6 | 6.4 | 1.2 |
| Construction & materials | 5.9 | 1.2 | 4.7 | 0.9 |
| Oil & gas | 12.6 | 9.1 | 3.4 | 2.9 |
| Basic resources | 10.0 | 7.5 | 2.5 | 0.7 |
| Insurance | 6.0 | 3.7 | 2.3 | 0.2 |
| Technology | 1.0 | 0.7 | 0.3 | 0.5 |
| Personal & household goods | 0.4 | 0.4 | 0.0 | 0.0 |
| Automobiles & parts | 0.0 | 0.0 | 0.0 | 0.0 |
| Chemicals | 0.0 | 0.3 | -0.3 | 0.0 |
| Telecommunications | 0.8 | 1.3 | -0.4 | -1.3 |
| Retail | 2.2 | 3.1 | -0.8 | -0.5 |
| Travel & leisure | 2.2 | 3.5 | -1.4 | -1.9 |
| Utilities | 2.0 | 4.7 | -2.8 | -0.3 |
| Media | 0.0 | 2.9 | -2.9 | -0.5 |
| Industrial goods & services | 6.6 | 12.3 | -5.7 | 1.1 |
| Health care | 6.7 | 12.8 | -6.1 | 0.3 |
| Food & beverage | 2.0 | 11.9 | -9.9 | -4.2 |
Source: Artemis as at 20 July 2026
We are inclined to run our winners and have therefore allowed exposure to banks and financial services to increase, although we are now at our typical sector limit within the former.
In terms of specific adjustments to the portfolio, our largest sector increase was in oil & gas, where we were previously light. Increases in Shell, BP and Eni brought us into overweight territory. Glencore was our largest purchase, funded partly through reducing Boliden.
Our largest reduction was to the food & beverage sector, with a sale of Coca-Cola HBC. We also exited Imperial Brands and J Sainsbury. For Coca-Cola HBC and J Sainsbury, share prices outpaced fundamentals, warranting some caution. Deteriorating fundamentals were the main catalyst for our sale of Imperial Brands. Outside of these names, notable trims/sales included Standard Chartered, Vodafone and IAG.
CAPITAL AT RISK. All financial investments involve taking risk and the value of your investment may go down as well as up. This means your investment is not guaranteed and you may not get back as much as you put in. Any income from the investment is also likely to vary and cannot be guaranteed.
This is a marketing communication. Before making any final investment decisions, and to understand the investment risks involved, refer to the fund prospectus (or in the case of investment trusts, Investor Disclosure Document and Articles of Association), available in English, and KIID/KID, available in English and in your local language depending on local country registration, available in the literature library.

Risks specific to Artemis SmartGARP UK Equity Fund
- Market volatility risk The value of the fund and any income from it can fall or rise because of movements in stockmarkets, currencies and interest rates, each of which can move irrationally and be affected unpredictably by diverse factors, including political and economic events.
- Currency risk The fund’s assets may be priced in currencies other than the fund base currency. Changes in currency exchange rates can therefore affect the fund's value.
- Charges from capital risk Where charges are taken wholly or partly out of a fund's capital, distributable income may be increased at the expense of capital, which may constrain or erode capital growth.
The intention of Artemis’ ‘investment insights’ articles is to present objective news, information, data and guidance on finance topics drawn from a diverse collection of sources. Content is not intended to provide tax, legal, insurance or investment advice and should not be construed as an offer to sell, a solicitation of an offer to buy, or a recommendation for any security or investment by Artemis or any third-party. Potential investors should consider the need for independent financial advice. Any research or analysis has been procured by Artemis for its own use and may be acted on in that connection. The contents of articles are based on sources of information believed to be reliable; however, save to the extent required by applicable law or regulations, no guarantee, warranty or representation is given as to its accuracy or completeness. Any forward-looking statements are based on Artemis’ current opinions, expectations and projections. Articles are provided to you only incidentally, and any opinions expressed are subject to change without notice. The source for all data is Artemis, unless stated otherwise. The value of an investment, and any income from it, can fall as well as rise as a result of market and currency fluctuations and you may not get back the amount originally invested.