SmartGARP’s Wolstencroft: Why I had such a lousy October


Key takeaways
- Share prices tend to follow fundamentals over the long term
- The two often diverge from one another over short periods, such as last month when businesses with poor fundamentals beat those with good fundamentals
- By staying focused on undervalued businesses that are growing their earnings, Philip Wolstencroft is confident last month’s underperformance will be nothing more than a blip
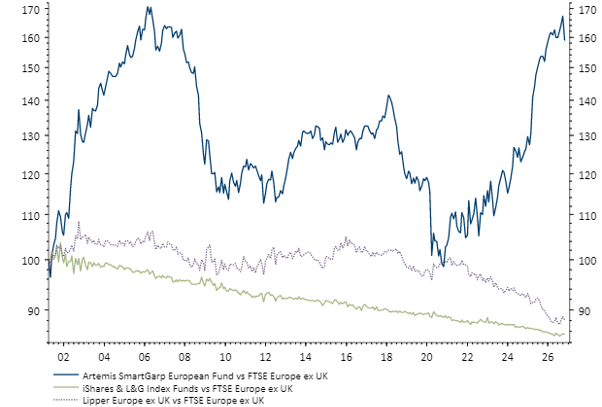
Artemis SmartGARP European Equity had a lousy October, trailing the benchmark by 4.9 percentage points1. This means it has given up a large chunk of its year-to-date outperformance.
Of the 308 months we have run this fund, October was the eighth worst2, meaning it is up there in terms of the periods I would rather forget about. Ordinarily, you might expect a fund manager to talk about stock and sector performance attribution. We tend to look at things differently and are more inclined to focus on how stock factor characteristics have performed.
Last month in context
Source: LSEG Datastream
It was our exposure to ‘upgrade’ and ‘price momentum’ stocks that caused the damage.
When I look at the sector, country, size and style tilts taken by peers, I would estimate this fund is in the 86th percentile of active bets3. But while it is an active fund that has done exceptionally well over the years, by definition it has had to endure some difficult periods.
A poor month for fundamentals
October was a poor month for many of the factors we track. The table below shows how the best 20% of stocks performed versus the worst 20% in different regions and factors over the month.
Performance of best vs worst 20% of factor stocks in October 2026
| Growth | Value | Revisions | Momentum | Accruals | Macro | Investor sentiment | High risk | Total | |
| Global | -0.4% | 6.8% | -9.8% | 5.6% | 7.5% | -8.9% | -1.5% | -13.1% | -2.4% |
| US | 9.0% | 11.0% | -1.3% | 4.5% | 10.4% | -3.7% | -3.1% | -9.4% | 8.1% |
| Europe | -0.2% | -1.4% | -5.9% | -3.7% | 3.7% | -7.5% | 0.7% | -9.1% | -6.7% |
| EM | 2.2% | 7.7% | -3.7% | 7.7% | 3.6% | -4.4% | 2.6% | -13.8% | 5.5% |
Source: Artemis. Total return, GBP
So, we see that stocks receiving upgrades underperformed those receiving downgrades by close to 10 percentage points in the global universe, 1 percentage point in North America and 6 percentage points in Europe4.
The simultaneous poor performance of the revision, momentum and economic factors meant that good SmartGARP stocks had a lousy month in Europe and unsurprisingly the fund did poorly.
Over the years, the above table would be full of positive returns – so last month was certainly unusual. The issue is whether this hints at bad things to come.
| One month | Three months | Six months | One year | Three years | Five years | |
| Artemis SmartGARP European Equity Fund | -6.2% | -6.9% | 1.0% | 13.5% | 103.8% | 123.1% |
| FTSE World Europe ex UK index | -1.3% | -3.3% | 3.2% | 9.7% | 55.1% | 53.5% |
| IA Europe excluding UK NR | -2.0% | -3.4% | 3.4% | 6.8% | 45.9% | 36.5% |
Past performance is not a guide to the future. Source: Lipper Limited/Artemis for class I accumulation GBP to 31 October 2026. All figures show total returns with dividends and/or income reinvested, net of all charges. Performance does not take account of any costs incurred when investors buy or sell the fund. Returns may vary as a result of currency fluctuations if the investor's currency is different to that of the class. Classes may have charges or a hedging approach different from those in the IA sector benchmark.
Concerns about tech profitability
In the US, the markets are starting to fret about the future profitability of the technology sector. I share these concerns – capacity has increased rapidly (which could undermine pricing power), investors have become crowded in this part of the market and speculation is rife.
As such, we have an underweight in the (comparatively small) European tech sector and a 5% cash position. However, this didn’t offer us any protection. The knee-jerk reaction of investors is to sell stocks that have gone up a lot – tech companies in the US and in Europe the banks, where we are overweight.
Of course, it makes little sense to sell European banks when there are problems in US tech stocks, but that is the nature of markets: shoot first, think later.
No correlation in month-to-month performance
One concern investors may have is this month broke a great run and the SmartGARP funds could now be stuck in reverse gear. Yet an equation called the autocorrelation of monthly relative returns shows the folly of this mindset. This figure is a shade under 50%5 – meaning next month’s directional relative performance has a 50% chance of being the same as October’s and a 50% chance of going in the opposite direction.
It makes little sense to sell European banks when there are problems in US tech stocks, but that is the nature of markets: shoot first, think later
Moreover, taking our worst 16 months (in order to put October in the middle of the pack), we can see how the fund did in the next year. The average subsequent relative return was +2.9 percentage points (so slightly above average), with four below-market returns, 11 above-market returns and last month’s outcome still to be determined6.
Another concern investors may have is our overweight in banks when most of our peers take the opposite approach. It has been an incredibly successful position over the past few years and so last month’s poor showing from the sector will encourage a few “I told you so” comments. Yet banks have done well because they started off cheap, benefited from plenty of positive surprises, were underowned and management behaved themselves.
The sector is not as cheap as it was (but is still lowly priced) and investors are less underweight than before. Management action is still constructive but the issue is whether analysts keep raising their forecasts: so far in Q3 results season, they have gone the other way. My suspicion is that analysts have cut estimates not because of any bad news but because the share prices fell and they don’t want to go out on a limb.
Over the past few months, bank EPS (earnings per share) forecasts have risen faster than all sectors bar oil & gas. Nevertheless, we have trimmed our weight by a couple of percentage points in reaction to these downgrades. It could be that we cut our overweight entirely in the next few months, but the data suggests we hold fire for now – as ever, this is what drives our decisions.
Adding value through stock selection
As a reminder, over the past 25-odd years, more than 80% of our added value has come from stocks rather than sectors. So while we may worry about our sector bets, logic suggests we should concentrate on owning the best stocks regardless of the industry in which they operate.
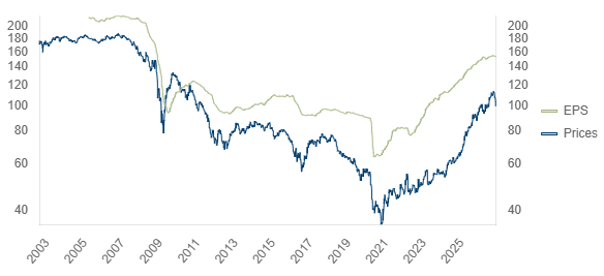
The chart below shows the European banking sector versus the European market in terms of performance and EPS forecasts. The fundamentals are still rising, albeit not as sharply as earlier in the year.
Source: LSEG Datastream
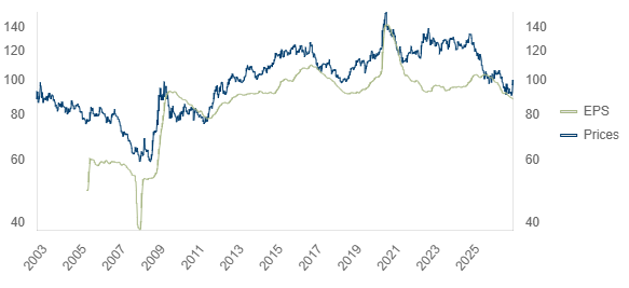
At the other end of the spectrum, the positive price action has been in good quality/defensive poor performers such as healthcare.
Source: LSEG Datastream
The sector has had a bounce but it is a bit like catching a falling knife – I would rather not.
In summary, we have a process that has steered us towards businesses that have subsequently outgrown the market. Since stocks that outgrow their fundamentals tend to deliver outsized returns, our fund has done well.
Last month was a reminder that we are not immune to swings in sentiment and whilst it is unpleasant, it is not the first time it has happened – nor will it be the last.
Notes and references
1. Lipper Limited, mid to mid in sterling (or the indicated currency) to the date shown. All figures show total returns with dividends reinvested. Benchmark is FTSE World Europe ex UK TR GBP.
2. Artemis
3. Artemis as at 30 September 2026. Note: Fund is Artemis SmartGARP European Equity Fund. Benchmark is FTSE World Europe ex. UK TR
4 .Artemis SmartGARP
5. Artemis
6. Artemis
FOR PROFESSIONAL INVESTORS AND/OR QUALIFIED INVESTORS AND/OR FINANCIAL INTERMEDIARIES ONLY. NOT FOR USE WITH OR BY PRIVATE INVESTORS.
CAPITAL AT RISK. All financial investments involve taking risk and the value of your investment may go down as well as up. This means your investment is not guaranteed and you may not get back as much as you put in. Any income from the investment is also likely to vary and cannot be guaranteed.
This is a marketing communication. Before making any final investment decisions, and to understand the investment risks involved, refer to the fund prospectus (or in the case of investment trusts, Investor Disclosure Document and Articles of Association), available in English, and KIID/KID, available in English and in your local language depending on local country registration, available in the literature library.
Risks specific to Artemis SmartGARP European Equity Fund
- Market volatility risk The value of the fund and any income from it can fall or rise because of movements in stockmarkets, currencies and interest rates, each of which can move irrationally and be affected unpredictably by diverse factors, including political and economic events.
- Currency risk The fund’s assets may be priced in currencies other than the fund base currency. Changes in currency exchange rates can therefore affect the fund's value.
- Charges from capital risk Where charges are taken wholly or partly out of a fund's capital, distributable income may be increased at the expense of capital, which may constrain or erode capital growth.
Important information
The intention of Artemis’ ‘investment insights’ articles is to present objective news, information, data and guidance on finance topics drawn from a diverse collection of sources. Content is not intended to provide tax, legal, insurance or investment advice and should not be construed as an offer to sell, a solicitation of an offer to buy, or a recommendation for any security or investment by Artemis or any third-party. Potential investors should consider the need for independent financial advice. Any research or analysis has been procured by Artemis for its own use and may be acted on in that connection. The contents of articles are based on sources of information believed to be reliable; however, save to the extent required by applicable law or regulations, no guarantee, warranty or representation is given as to its accuracy or completeness. Any forward-looking statements are based on Artemis’ current opinions, expectations and projections. Articles are provided to you only incidentally, and any opinions expressed are subject to change without notice. The source for all data is Artemis, unless stated otherwise. The value of an investment, and any income from it, can fall as well as rise as a result of market and currency fluctuations and you may not get back the amount originally invested.