Artemis SmartGARP European Equity Fund
Q3 2026 update

Source for all information: Artemis as at 29 September 2026, unless otherwise stated.
Market review
The fund had a good quarter – it was up 1.9% at a time when its FTSE World Europe ex UK index benchmark fell 2.5%. Year to date the fund is up 13.5% (compared with 7.5% from its benchmark) while since inception it has returned 9.7% per annum compared with 7.2% from its benchmark. So the fund has a 25-year track record of beating both the market and our competitor funds and 2026 has been no exception. I think the reason behind these fantastic outcomes has been owning lowly valued companies that subsequently deliver decent growth. The means to achieving this is our SmartGARP process which we have stuck to for more than a quarter of a century.
| Three months | Six months | One year | Three years | Five years | |
|---|---|---|---|---|---|
| Artemis SmartGARP European Equity Fund | 1.9% | 13.8% | 24.5% | 111.0% | 142.3% |
| FTSE World Europe ex UK index | -2.5% | 9.6% | 14.5% | 52.4% | 60.2% |
| IA Europe excluding UK NR | -1.3% | 11.0% | 12.6% | 43.7% | 42.0% |
Past performance is not a guide to the future. Source: Lipper Limited/Artemis for class I accumulation GBP to 30 September 2026. All figures show total returns with dividends and/or income reinvested, net of all charges. Performance does not take account of any costs incurred when investors buy or sell the fund. Returns may vary as a result of currency fluctuations if the investor's currency is different to that of the class. Classes may have charges or a hedging approach different from those in the IA sector benchmark.
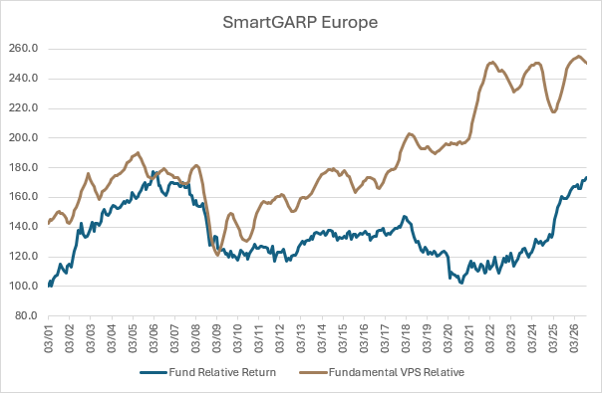
The chart below illustrates the performance of our fund (after fees) against the market. The value per share (a blend of earnings per share, cash per share, dividends per share, book value per share and so on) has been growing by about 2.1 percentage points per annum faster than the market (gold line) and, hey presto, the returns from our fund versus the market (blue line) have been growing by about 1.9 percentage points per annum.
Alighting on stocks with a superior combination of yield and growth is the reason (I believe) why our fund has performed so well. The returns over the past few years have been above trend because the previous few years were below trend. The gap between the two lines is still wide (our fund is on much lower multiples than the market) and we see no evidence that our process will suddenly stop working now (the uptrend in the gold line is not flattening out). All in all, we remain optimistic on this fund.
Source: Artemis/Factset 30 September 2026
Positioning
In our view, Europe is less risky than the US (yields are higher, earnings per share [EPS] are on trend rather than above it and there is less speculative behaviour within markets). As such, we think owning stocks listed on the continent should offer some protection against a global crash. For the past four months or so we have been running with cash levels of about 5% – again this reduces the riskiness of the portfolio. In addition, we hold lowly valued stocks (about 30% cheaper than the market) which are generally seeing upgrades to profit forecasts. This does not mean that the portfolio is bullet proof, rather that it offers a good combination of upside potential and downside protection.
I suspect today’s conditions are not dissimilar to those when we started the fund just over 25 years ago. At that stage we had practically zero exposure to technology, media or telecom stocks. The fund had a spectacular few years – in part because it fell by less than the market but also because it did well in the subsequent bull run. Essentially, we managed to avoid most of the biggest losers and in the meantime owned dull but growing companies on modest valuations. Timing market falls is fraught with difficulty and is almost guaranteed to induce huge amounts of stress. I am not suggesting a bear market is around the corner, just that investors need to be careful and I believe our fund is as well positioned as it can be.
Banks
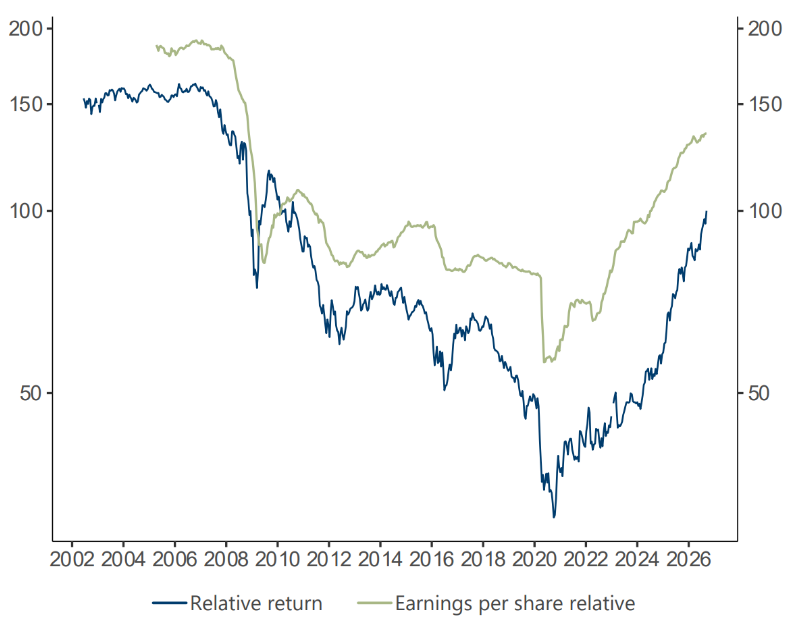
One of the most persistent questions we are asked is “when are you going to sell your banks?” The answer so far is “not yet”. Without wishing to sound like a stuck record, the stocks are still cheap, growth is okay, management are shareholder friendly and analysts keep raising their profit forecasts. Until other parts of the market offer a better combination, we are inclined to sit tight. The constituents of our favoured few keep changing but the overall theme remains in place. Below we see the prospective rolling 12-month forward EPS forecasts for the banking sector are still rising versus the market. The share prices keep getting dragged upwards. As the saying goes: in a bull market, investors climb a wall of worry. While others worry, we look at the data.
Source: LSEG Datastream
Outlook
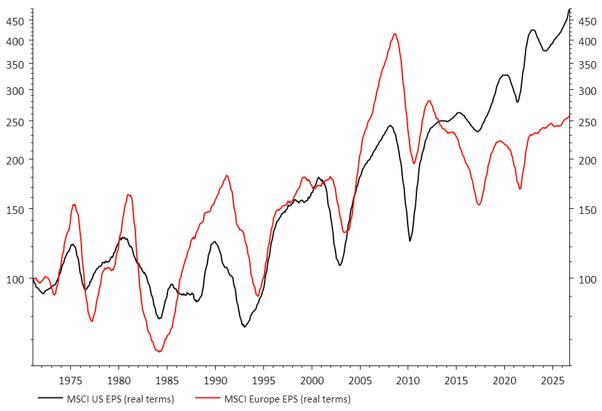
The return on any asset is primarily a function of its current yield and future growth rate. For example, if the dividend yield is 3% and growth 5% then I would expect the return to be about 8%. Since inflation eats into spending power, it is helpful to take account of rising consumer prices. Below I illustrate the trend of EPS (in real terms) for the US and European equity markets over the past 56 years.
The US has had better growth than Europe
Source: LSEG Datastream
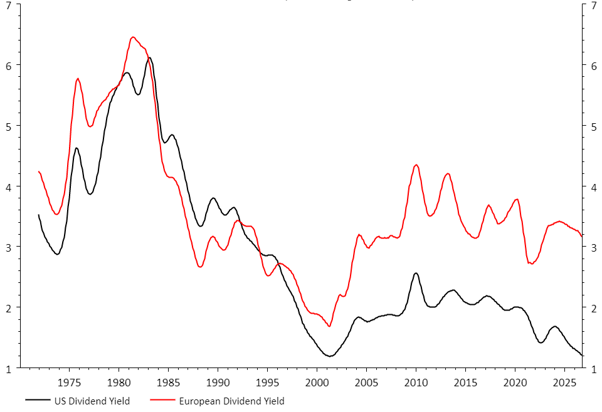
The US has grown its EPS by about 2.8 percentage points per annum over this time while Europe has only managed 1.7 percentage points. Since they started off with pretty similar dividend yields, we find that the returns from US equities should have been about 1.1 percentage points per annum higher than those of Europe. In fact, they have been higher than this because as US growth has improved, optimism has increased and valuations have risen. Going forward, the starting dividend yield in the US is now about 2 percentage points lower than in Europe.
This has resulted in US equities moving onto lower yields
Source: LSEG Datastream
From this point forward, growth in the US needs to be 2% per annum higher than in Europe to justify the current valuation gap. It may happen (let’s face it, growth has been 4% per annum higher for the past decade), but my concern is that peak optimism may coincide with a turning point in fortunes. My view is that AI will be wonderful for consumers, but less so for the producers. It is a capital-intensive business model where the return on capital is hugely negative and the losses (so far) have scaled with revenues – the bigger the sales, the bigger the losses and, with competition intense, it is not obvious why this unfortunate combination is about to change.
Thus far the EPS of the US market has been boosted by companies selling components (such as semiconductors) to AI producers and hyperscalers, but the costs have not yet been booked. From an accounting perspective it is correct, but it is not without concerns for those that study cashflows. Costs will start to be booked from next year, so it could be that market EPS are currently somewhat above trend.
In the meantime, the AI producers are about to be floated on the market. The addition of loss-making companies will pull the EPS of the market down. The hope is that the growth rates will then continue to trend upwards. What if they don’t? Public markets can be quite impatient. After all, investors will have to keep funding losses and keep buying stock from the current (private) holders. There is a chance that US equity investors may start to lose their sense of humour. In the meantime, bond yields keep rising. For a market on unusually high valuations, this is not helpful.
FOR PROFESSIONAL INVESTORS AND/OR QUALIFIED INVESTORS AND/OR FINANCIAL INTERMEDIARIES ONLY. NOT FOR USE WITH OR BY PRIVATE INVESTORS.
CAPITAL AT RISK. All financial investments involve taking risk and the value of your investment may go down as well as up. This means your investment is not guaranteed and you may not get back as much as you put in. Any income from the investment is also likely to vary and cannot be guaranteed.
This is a marketing communication. Before making any final investment decisions, and to understand the investment risks involved, refer to the fund prospectus (or in the case of investment trusts, Investor Disclosure Document and Articles of Association), available in English, and KIID/KID, available in English and in your local language depending on local country registration, available in the literature library.

Risks specific to Artemis SmartGARP European Equity Fund
- Market volatility risk The value of the fund and any income from it can fall or rise because of movements in stockmarkets, currencies and interest rates, each of which can move irrationally and be affected unpredictably by diverse factors, including political and economic events.
- Currency risk The fund’s assets may be priced in currencies other than the fund base currency. Changes in currency exchange rates can therefore affect the fund's value.
- Charges from capital risk Where charges are taken wholly or partly out of a fund's capital, distributable income may be increased at the expense of capital, which may constrain or erode capital growth.
Important information
The intention of Artemis’ ‘investment insights’ articles is to present objective news, information, data and guidance on finance topics drawn from a diverse collection of sources. Content is not intended to provide tax, legal, insurance or investment advice and should not be construed as an offer to sell, a solicitation of an offer to buy, or a recommendation for any security or investment by Artemis or any third-party. Potential investors should consider the need for independent financial advice. Any research or analysis has been procured by Artemis for its own use and may be acted on in that connection. The contents of articles are based on sources of information believed to be reliable; however, save to the extent required by applicable law or regulations, no guarantee, warranty or representation is given as to its accuracy or completeness. Any forward-looking statements are based on Artemis’ current opinions, expectations and projections. Articles are provided to you only incidentally, and any opinions expressed are subject to change without notice. The source for all data is Artemis, unless stated otherwise. The value of an investment, and any income from it, can fall as well as rise as a result of market and currency fluctuations and you may not get back the amount originally invested.