Why growth compounders aren’t always consistent
Alex Stanić of the Artemis Funds (Lux) Global Select Fund explains why you don’t need to limit yourself to ‘expensive defensives’ if you want to compound earnings growth over the long term – cyclicals also offer this trait, so long as you are willing to look past short-term peaks and troughs.
It would be difficult to think of an investor who wouldn’t want to own a quality-growth company with a high return on equity that consistently compounds earnings growth in good times and bad.
Yet such companies tend to be priced to perfection and quickly find themselves on the wrong end of a hefty correction if they fail to live up to these expectations in any way.
Like many growth investors, the managers on the Artemis Funds (Lux) Global Select look for financially solid businesses that tap into long-term themes and have a competitive advantage that allows them to maintain a high return on equity.
However, where we differ is in our refusal to pay over the odds for these businesses. This means we have to widen our focus in our search for growth compounders and consider cyclical companies as well as ‘expensive defensives’.
A compounding cyclical may sound like an oxymoron – after all, aren’t the quality growth businesses famed for consistently compounding earnings diametrically opposed to the economically sensitive stocks that surge in the boom times then slump in the bad?
This is not necessarily the case, especially if you take a step back and look at the short-term peaks and troughs in the context of long-term growth.
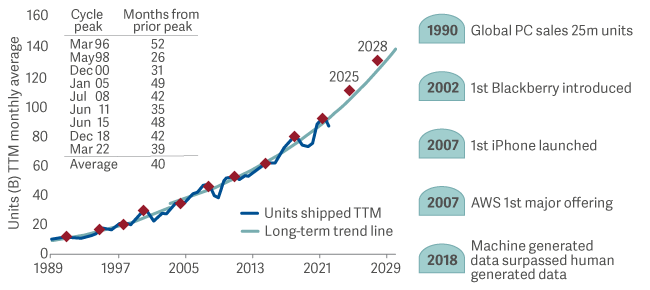
The semiconductor industry is a good example. It probably won’t surprise you to learn that the total number of (ex-memory) semiconductors shipped has grown from 10 billion to almost 1 trillion since 19891, a year before the home-computing sector hit the milestone of 25 million PC sales2. What might surprise you is the stop-start nature of this growth, taking an average of 40 months for shipments to reach their prior peak in the nine boom-and-bust cycles seen over this time3. Consistent it wasn’t.
Theme - long term growth drivers
Semiconductor units shipped
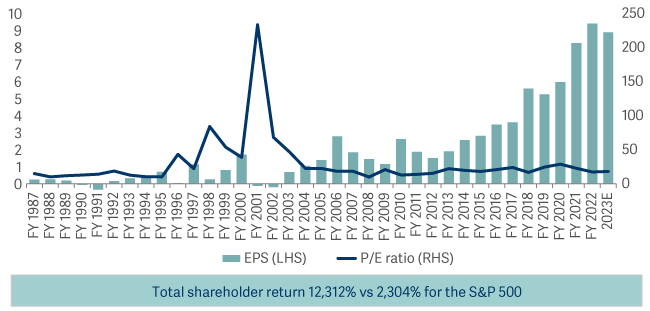
One stock that mirrors this inconsistent growth profile is US-based semiconductor manufacturer Texas Instruments.
Reviewing its progress on a year-by-year basis since 1987 highlights the cyclical nature of its fortunes, with its earnings per share (EPS) bouncing around all over the place. Its price-to-earnings (P/E) ratio has been even more volatile, reaching an extraordinary peak in the tech bubble of 2000.
Yet despite its short-term cyclicality, the long-term direction has been upwards, and its earnings have compounded at an average rate of 11% per annum over that 36-year period4. Anyone who bought Texas Instruments’ shares in 1987 and held them until today would have made a total return of 12,312%, more than five times as much as the 2,304% gain from the S&P 500.
Thematic context - at stock level
Texas instruments - cyclical, but beneficiary of long term increase in semiconductor use
We don’t shun all stocks in defensive sectors, as even those that may initially look expensive can trade on valuations that underestimate their long-term potential.
One example in the healthcare sector is EssilorLuxottica. The company is perhaps best known in the West for its sunglasses, including brands such as Ray-Ban and Oakley. However, we are more interested in its lens-crafting business, which is benefiting from multiple tailwinds.
There are currently 2.6 billion people worldwide who have myopia and require vision correction, equivalent to 34% of the population5. That figure is expected to grow to 4.7 billion by 20506. Shockingly, fewer than half of those people have access to ophthalmological care.
As wealth creation rises across the developing world, so too will spending on eyecare. This is why we think the company can increase its earnings at 11% per annum over the long term, with organic sales growth of 6%.
The business also has high margins and a low level of gearing. Taken together, this puts it on a free cashflow yield of about 6% and an EBITDA (earnings before interest, tax, depreciation and amortization) of 10x. We think it is exactly the sort of stock that can power superior returns over the long term.
It’s worth reiterating that we’re not trying to find companies that look perfect. We're trying to find quality companies where there is room for error at the valuation we buy in at. This is what gives us a margin of safety – if not necessarily one of consistency.
2. WSTS excluding memory trailing twelve months as at 2 February 2023
3. WSTS excluding memory trailing twelve months as at 2 February 2023
4. Company as at 30 September 1989 to 31 May 2023, current year P/E, GAAP EPS
5. Company as at 30 September 1989 to 31 May 2023, current year P/E, GAAP EPS
6. EllisorLuxottica ‘Capital Market Day’, 25 September 2019