SmartGARP®
Pinpointing hidden profit potential
While the mechanics of SmartGARP are clever, its purpose is simple: to search for and pinpoint profit potential within vast and dense terrains.
SmartGARP explained
In this video, we look at five key elements: the tool, process, team, funds and track record.
The SmartGARP fund range
Performance since launch
Artemis SmartGARP European Equity Fund
390.1%
351.1%
Launch date: March 2001. Benchmark is FTSE World Europe ex UK TR and index is IA Europe Excluding UK NR. Class I Acc GBP. Data prior to 7 March 2008 reflects class R accumulation GBP.
Artemis SmartGARP Global Emerging Markets Equity Fund
60.5%
65.2%
Launch date: April 2015. Benchmark is MSCI EM (Emerging Markets) NR and index is IA Global Emerging Markets NR. Class I Acc GBP. Data prior to 7 March 2008 reflects class R accumulation GBP.
Artemis SmartGARP UK
Equity Fund
441.9%
384.8%
Launch date: September 2002. Benchmark is FTSE All-Share and index is IA UK All Companies. Class I Acc GBP. Data prior to 1 September 2010 reflects class R accumulation GBP.
Artemis SmartGARP Global
Equity Fund
650.0%
580.3%
Launch date: September 2002. Benchmark is MSCI AC World NR and index is IA Global NR. Class I Acc GBP. Data prior to 7 March 2008 reflects class R accumulation GBP.
Why SmartGARP is signalling now is the time for value in Europe
The shift from value to growth has led many professional investors into the same type of company in the hope their shares will carry on rising. Product specialist, Harry Eastwood reveals how to avoid the sort of ‘instant karma’ they experience when valuations revert.
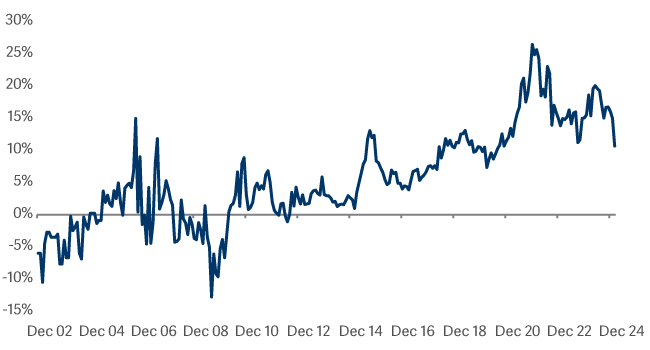
"Check out the price/earnings chart below and see if you can work out which John Lennon song pops into my head every time I look at it. And before you ask – no, it’s not Give P/Es a Chance (sorry)."
The chart shows the P/E ratios of actively managed European equity funds versus those of the index. It reveals how active managers in this arena have transitioned from being value investors in 2002 to being growth investors in 2025. All told, the move represents a shift from a 10% discount to a 20% premium. This kind of makes sense, given the extended period during which growth has outperformed value in Europe.
Active Funds PE vs Index Funds (Europe ex UK Universe)
Frequently Asked Questions
Why did we develop the SmartGARP approach?
The investment process was developed by Philip Wolstencroft during his time working as an equity strategist at Merrill Lynch. He developed it in an attempt to distil what all active fund managers do, but in a more systematic way and to remove the behavioural biases he often observed from fund managers in his role as a strategist. It was based on the belief that inefficiencies exist in global stock markets because investors do not always act rationally. SmartGARP seeks to address this by using data to be more objective, rigorous and systematic in the analysis of companies’ financial characteristics and in decision-making.
The first fund to use the process was the Artemis SmartGARP European Equity Fund, launched when Philip joined Artemis in 2001. The process has been developed and refined ever since.
What is SmartGARP?
From a universe of approximately 7,000 global companies – with minimum levels for market cap (US$500mn), liquidity and analyst coverage applied – SmartGARP aims to identify companies that are growing faster than the market but are trading on lower valuations than the market. They should be enjoying strong and consistent upgrades to profit forecasts and be under-owned by the investment community, while at the same time benefiting from helpful macroeconomic trends. In other words, ‘growth at a reasonable price’ (GARP).
How does the SmartGARP philosophy work in practice?
We believe that share prices ultimately follow fundamentals. To illustrate this, we look at ‘value per share’ (VPS) as an aggregate measure of a stock’s fundamentals. VPS is a combined measure of earnings, cash flow, operating profits, dividends and asset value per share. Divergences between the share price and the VPS can signal an opportunity or a risk.
In the long-term, we believe the two are highly correlated and held together by an elastic band. Divergences can occur between the two, but usually these will snap back and correct. At times, share prices can overshoot the performance of the business. This is often down to over-optimism about future growth prospects or a lack of account for risks to growth.
How does the tool identify stocks with ‘GARP’ characteristics?
The SmartGARP tool uses eight different measures to analyse stocks within a given universe:
Top-down factors
Macro
Investor sentiment and ownership
Bottom-up factors
Growth and Value
Estimate revisions
Momentum
ESG factors
Accruals
See above for more detailed explanations of each one.
Are all factors treated equally?
Each factor is given equal weighting apart from ‘estimate revisions’ which is double weighted. This is because the team view earnings upgrades as the strongest and most reliable indicator of an improving share price.
The value factor varies between being half weighted and double weighted to reflect the dispersion of valuations and the recent performance of value investing.
How does SmartGARP filter down from the universe of thousands of stocks to the number in a portfolio?
There are over 7,000 stocks in the investible universe. We rank every company on eight factors and, then rank them against the universe to give them an overall ‘SmartGARP score’ out of 100. Companies with a score above 80 are considered for inclusion in the fund. The fund managers then carry out due diligence on these stocks. This is to identify non-operational issues (such as accounting changes, acquisitions or disposals etc.) that may be skewing the data. The fund manager then builds a diversified portfolio according to the stock and sector limits of the strategy.
Is this just a quant/blackbox approach?
No. SmartGARP is an evidence-based approach to investing, incorporating well understood and accepted investment principles, but deployed in a systematic fashion. It mimics how most fundamental investors would think about things but avoids many of the biases that traditional managers can suffer from.
In client meetings, we regularly demo the tool to provide transparency and help explain how the fund managers interact with the system to make decisions.
How does the fund manager overlay work in practice?
We consider the process to be 80% systematic, 20% fund manager overlay. After running the screening tool, the fund managers carry out due diligence on the stocks that score highly. This is to identify non-operational issues (such as accounting changes, acquisitions or disposals etc.) that may be skewing the data.
This is strictly a validation exercise to ensure that the financial data is a complete and accurate reflection of the underlying characteristics of a company. The fund manager is not looking to gain detailed insights of the company’s business or meet its management which might compromise the investment process by introducing subjectivity and behavioural bias.
The other element driven by the managers is the timing of investment decisions.
At times of severe market distress, such as the start of the Covid pandemic, the fund manager overlay plays a bigger role.
How often is the stock screen ranking updated?
The screening tool is run daily.
What prompts a manager to sell a stock?
The fund manager monitors the SmartGARP score, watching for persistent degradation. Typically, as the score fades towards 50 the manager will be trimming and reallocating to higher scoring companies. As the score falls below 50, that is typically a signal to sell the position. Trading activity is elevated around earnings season given this is when newsflow around a company’s fundamentals is at its highest.
In what kind of market environment does SmartGARP work best, and in what kind of environment does it struggle?
SmartGARP works in most market conditions apart from times of extreme stress, such as the Global Financial Crisis or Covid. The volatility skews data in the short term, as the tool normally focuses on identifying long-term patterns. At this point the human element of the process plays a bigger role.
How many funds use the tool?
There are four Artemis funds that use the SmartGARP process: Global, European, UK and Global Emerging Markets.
Can the tool work in any market and if not, why?
SmartGARP works in any market, as is evidenced by the global fund, which invests in all regions. The tool works particularly well in under-researched areas, such as emerging markets and medium-sized companies (‘mid caps’) across all markets.
Over recent years it has worked less well in the US which has a great deal of analyst coverage and has recently been a highly concentrated market.
How has the tool evolved over time and why?
The tool has developed slowly and in a considered fashion to include new data and new data-capture techniques available.
The most recent substantive change was when the ESG factor was added in 2018. Other changes have been more incremental. The team constantly tests sources of data, but the core of the process remains largely unchanged.
The team’s dedicated quantitative IT developer focuses on data architecture design and facilitates in the testing of new and existing datasets.
From a style perspective, is SmartGARP a pure value strategy?
SmartGARP’s style bias has shifted through time. It is currently biased towards value, because that is where it is seeing opportunities. However, given the process incorporates a range of factors, you should also expect to see within the holdings, positive revisions, as well as good growth and quality characteristics.
How do you manage the factor tilts? What keeps you from going too far offside?
We do not have hard limits on factor tilts. But we monitor them and style tilts (e.g. towards growth, value, revisions, top down etc) which should not be negative for any significant length of time.
On a quarterly basis we have formal risk reviews with our independent Investment Risk Team. In these meetings, we cover a range of topics around portfolio positioning, trading decisions, attribution, and outlook.
Does SmartGARP lead to the funds having certain characteristic traits?
Given the nature of the tool, the funds have a high active share and look different to the peer group. This is because the tool casts the net wider than even a large team of analysts could, uncovering opportunities that others may miss.
It’s a small team for the size of assets under management, how does this work?
The tool screens the universe to direct the managers towards the best ideas. This means a large team of analysts is not necessary.
The tool is a powerful and efficient method of screening a large universe of stocks and focusing the fund managers attention on the best ideas according to SmartGARP. Time is not spent conducting deep fundamental research, meeting management, or managing a large pool of analysts.
In addition, a small team has its advantages; short lines of communication, quick decision making, and ownership of the outcome engenders positive outcomes.