Artemis SmartGARP Paris-Aligned Global Equity Fund update
Peter Saacke and Raheel Altaf, managers of the Artemis SmartGARP Paris Aligned Global Equity Fund, report on the fund over the quarter to 30 June 2023.
Highlights
- The fund lagged buoyant markets due to its low weighting in mega cap growth exposure
- The fund was flat (returning 0.0%) versus 3.3% rise of benchmark during the quarter.
- AI enthusiasm coupled with optimism regarding the outlook for inflation and growth drives markets higher.
- Underweights in Apple, NVIDIA, Microsoft and Amazon, the four biggest performance detractors, costing 2.2%-age points in aggregate.
- Few changes to regional and sectoral positioning: still most overweight banks, insurance and consumer staples, underweight tech, retail and healthcare.
- Prefer emerging markets, Europe and Japan to US equities.
- Fund sticking to its tilt towards value and low risk
Performance – AI enthusiasm and economic optimism fuel stock market rally
Excitement surrounding the prospects of artificial intelligence to boost productivity and (some) companies’ profits helped extend the strong performance of a number of mega cap technology stocks. Falling headline rates of inflation and evidence of the resilience of especially the US economy in spite of sharp monetary tightening heightened investor optimism further.
Accordingly, the MSCI All-Country World Paris-Aligned index rose by 3.3%, thus extending year-to-date gains to 8.3% in sterling terms. US equities led the way during the quarter, while European equities and especially emerging market stocks lagged. At the sector level, technology stocks in general and semiconductors in particular led the way with double digit gains, while resource stocks and companies in economically defensive sectors such as healthcare, utilities and telecoms trailed.
These trends were mostly headwinds for the performance of our fund. Our underweight in technology stocks hurt, as did our overweights in Europe and emerging markets. For the quarter as a whole, the fund’s net asset was flat versus a benchmark return of +3.3% in sterling terms.
In a repeat of Q1, seven of the top 10 detractors from performance were mega cap growth stocks that the fund did not hold, with the top four being underweight Apple, NVIDIA, Microsoft and Amazon. The only other material detractors from performance were our investments in Perion, an Israeli advertising technology company whose shares fell 25% during the quarter in spite of resilient company specific newsflow and our holding in Irish agricultural services group Origin which declined by 17%.
On the positive side, there were a few notable stock specific winners. Mears, the UK building service provider, rose almost 50% during the quarter on continued strong trading. Insurer Unum and pharmaceutical distributor McKesson (both US) also rerated materially on better-than-expected results. Finally, while emerging markets underperformed in general, our fund was and remains invested in a number of strongly performing stocks, including Sinotrans, Picc Property and Casualty (both China) and Banco do Brasil.
Activity – Sticking to overweights in financials and staples, especially in Europe and emerging markets
While there were no major changes in the fund’s key exposures during the quarter, portfolio turnover nonetheless remained material.
We thus bought back into Alphabet and Microsoft following evidence of a reacceleration of business trends and also added Johnson & Johnson back to the portfolio after its de-rating in the last five months. We also increased our exposure to utilities with new investments in the likes of E.ON (Germany) and Engie (France). Last, but not least, we added three new positions in the travel & leisure sector, with purchases of the likes of US freight transportation company CSX and airlines Alaska Air and United Airlines.
These purchases were funded from sales of industrials BAE Systems, Belden, Lincoln Electric and IDOM and construction firms China Railway Group, China Railway Construction and China State Construction Engineering.
Still, in spite of these changes, the fund’s principal exposures have not changed dramatically. Regionally we continue to be overweight in Europe (39% of fund versus 19% benchmark weight), emerging markets (16% versus 10%) and underweight especially in North America (39% versus 65%). At the sector level, we still prefer banks, insurance and consumer staples and remain very underweight technology and, to a lesser extent, retail and healthcare.
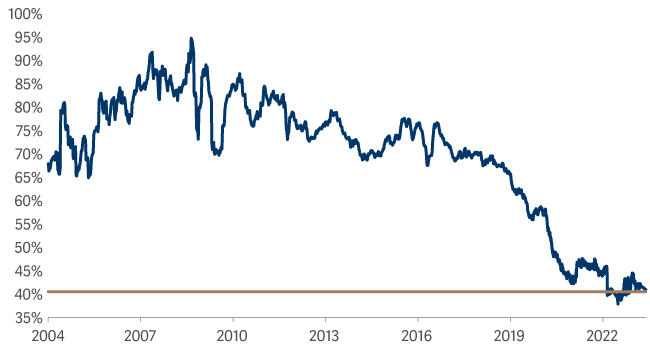
Last, but not least, the fund’s tilt towards value stocks remains very pronounced: at the end of September, the fund was trading on an average price-earnings ratio of 8.6 versus the benchmark at 17.3. This 50% discount to the market remains very low in the context of the more than 19.5 years the present manager has managed the fund.
Relative price-earnings ratio of SmartGARP Paris-Aligned Global Equity Fund vs. market
ESG – Continuing improvement of fund’s climate characteristics
As highlighted in previous quarterly reviews, in February 2022 we updated the fund’s objective and changed its benchmark to the MSCI ACWI Climate Paris-Aligned Index. The fund now has an explicit constraint that its overall temperature alignment must be below 2 degrees Celsius.1
Over the course of the last year the fund’s Implied Temperature Rise has fallen from 1.7 degrees Celsius at the end of March 2022 to 1.5 degrees at the end of June 2023 (see table below).
| Implied Temperature Rise | |
|---|---|
| Q1 '22 | 1.7 |
| Q2 '22 | 1.7 |
| Q3 '22 | 1.6 |
| Q4 '22 | 1.6 |
| Q1 '23 | 1.6 |
| Q2 '23 | 1.5 |
It is worth noting, though, that the fund’s progress towards a temperature alignment of 1.5 degrees Celsius has happened much faster than we anticipated when we changed the fund’s objective and benchmark last year. Pleasing though this development is, it is also partly a reflection of which companies SmartGARP, the proprietary quantitative stock screening tool we use to identify investment opportunities, highlights as most attractive at present.
For instance, in the last year, the fund’s exposure to energy, resource and industrials stocks has fallen as their relative attractiveness declined relative to stocks in sectors with a much lower carbon footprint such as software, insurance and media. Looking forward it is quite possible that a situation arises where the pendulum swings back somewhat and SmartGARP sees more investment opportunities in sectors with a larger carbon footprint.
To the extent that our fund aims to deliver good investment returns subject to a strict emission constraint of a temperature alignment of below 2 degrees Celsius, the fund may thus see an increase in its average Implied Temperature Rise from its present level of 1.5 degrees. Nonetheless, we expect that over the medium to long term the fund’s Implied Temperature Rise will decline towards, and hopefully eventually fall below 1.5 degrees.
In this context it is also worth noting that the recent improvement of the fund’s carbon footprint is but a continuation of a longer-term trend of the fund’s improving climate characteristics. These are related, in part, to the introduction of an explicit ESG factor into SmartGARP in 2019 and its further development in 2021.
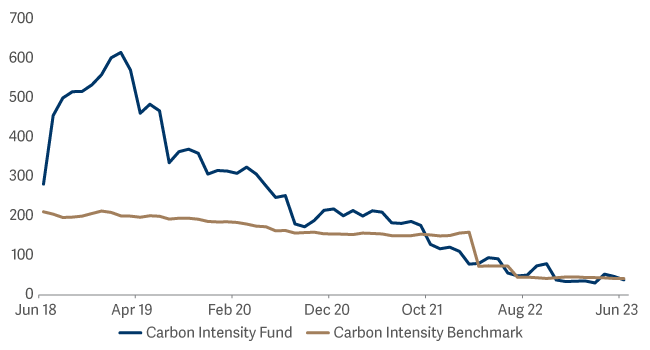
The chart below illustrates this trend well, showing the fund’s carbon intensity over the last few years. At the end of June 2023, the fund’s scope 1+2 carbon intensity stood at 38.9 tCO2 per $m of revenues versus the Paris-aligned index’s 40.1. By comparison the carbon intensity of an unconstrained broad global market index such as the MSCI All Country World index stands at 139.
Carbon Intensity Fund vs Benchmark
Outlook – Continued focus on company news flow rather than chasing the latest themes
The story of the year in global equities has been the resumption of leadership of mega cap growth stocks such as those mentioned above. Where available at valuations justified by strong fundamentals (such as Microsoft and Alphabet) we are happy to commit capital. In many other mega caps, however, we see the balance of risk and reward as unfavourable. This has been a severe headwind for performance this year, not least in May when thanks to elevated excitement over AI things went into overdrive.
Still, painful though they are, periods of very narrow leadership are typically short-lived. Therefore, rather than chase the latest themes we remain squarely focused on what companies are telling us regarding their individual business prospects to ensure that the fund’s positioning reflects this in a timely manner. Against this backdrop, our fund’s bias towards companies with resilient earnings and healthy balance sheets, which, as an additional layer of protection, trade on well below market valuations, continues to be warranted, in our view.