Have you spotted the ‘moonwalking bear’ of high-yield debt?
It’s easy to miss something you’re not looking for. Artemis’ Jack Holmes thinks this is why many of the largest asset managers have failed to notice the value towards the lower end of the high-yield market.
A minute-long video clip called “Awareness Test” went viral in 2008, racking up more than 10 million views, due to an editorial sleight of hand that challenged viewers to test their attention to detail, only to pull the rug from under their feet.
Inviting the viewer to count how many passes were made by a basketball team, the video showed about 20 seconds of a practice session before revealing the answer – 13. But it is here where things took a turn for the surreal, when it asked: “Did you see the moonwalking bear?”
The reason for this seemingly bizarre question was that while the viewers focused on counting the number of passes, most were completely oblivious to a man dressed in an amateur-looking bear costume strutting, gesticulating and moonwalking through the middle of the very basketball session they were supposed to be concentrating on.
The message of the video – released on behalf of Transport for London to promote awareness of cyclists among road users – was a simple one: “It’s easy to miss something you’re not looking for”.
So, what does this have to do with high-yield bonds?
Standout value
Our view is that while the extreme value available in some areas of the high-yield bond market may not quite be “strutting, gesticulating and moonwalking” in front of investors, it is obvious to those whose attention isn’t focused elsewhere.
The global high-yield market is made up of about 1,500 companies which have collectively issued debt worth more than $2trn1. Yet of those 1,500 companies, just 200 account for about half the index by weight2.
Artemis global high yield focuses on the wider market exploiting the under-covered and inefficiently priced "tail"

Most high-yield funds will focus on this area of the market, either because of their large size or because they are index-led. In contrast, running high-conviction funds allows us to focus on what we call ‘the undiscovered tail’.
I recently heard about a major asset manager running a number of large high-yield funds that won’t allow research resources to be put into issuers that are less than 10bps of the index. This means they wouldn’t even look at many of our holdings in the Artemis Funds (Lux) – Global High Yield Bond fund, such as auctioneer Sotheby’s and miner Perenti. At 3bps and 2bps3 of the index respectively, it would be polite to refer to these companies as a rounding error. In fact, they are not even that.
Informational advantage
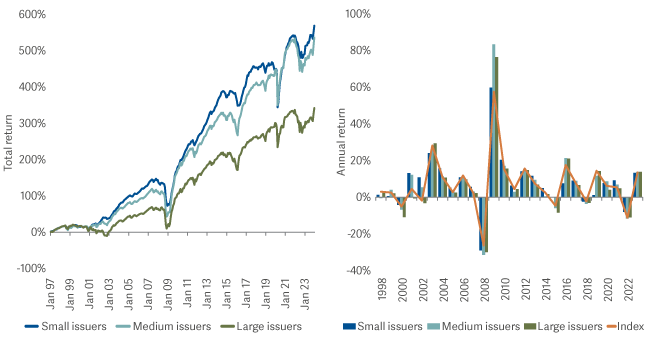
Less analyst coverage makes it easier to gain an informational advantage away from the largest issuers. But the data shows medium- and smaller-sized issuers have delivered higher returns than their larger counterparts since the inception of the global high-yield universe in 19974. In this way, it is similar to the small-cap effect in equities over the long term. But that is about as far as the comparisons go.
Whereas with equities, higher-longer term returns from smaller companies come at the expense of higher volatility, the opposite is true in high-yield bonds. In the years of the biggest losses for this market – after the bursting of the dotcom bubble, the Global Financial Crisis and Covid – small issuers lost less than medium and larger ones5.
It is important to remember that ‘smaller issuers’ does not mean ‘smaller companies’. Some have earnings in the billions, and market caps in the tens of billions, yet they are classed as smaller issuers for the simple reason that high yield does not account for a significant proportion of their capital stack.
Geographical opportunities
Moving away from the largest issuers is not the only way to obtain an advantage when it comes to high yield. Taking a genuine global approach can deliver a similar impact.
About 90% of the assets in high-yield funds are in those that focus on a particular region (mainly the US)6. While most of the rest of the money is in funds that claim to be global, I would argue that in many cases these are just two regional funds that have been stuck together and rebranded, managed with little if any reference to one other.
Running funds in this way means overlooking a quirk whereby an international company can issue two bonds from the same part of the capital structure and with the same maturity, but that offer different yields depending upon which country they are issued in.
Taking advantage of this mispricing doesn’t involve taking a complex macro view on the direction of currencies – we simply hedge this risk. But even after this cost is incurred, it has been possible to earn up to 3 percentage points more over the past two years by lending to certain companies in euros rather than dollars (and vice versa)7.
As the graph below shows, this relationship isn’t consistent and the prices of the euro/dollar bonds move around a lot. But the small size of our fund and relative freedom compared with more benchmark-driven approaches let us flip between the two whenever relative valuations suit. It also highlights that simple top-down allocation between different currencies won’t capture these opportunities – these only come about through bottom-up analysis.
The vast majority of high yield AuM is in funds with a regional approach*, which leads to inefficient pricing opportunities for truly global investors**

The moonwalking bear market
For investors who saw the title of this article and assumed it referred to a high-yield bear market, the good news is that improving economic conditions and the prospect of falling interest rates make this unlikely.
In addition, when yields from this asset class have been this high in the past (the ICE BofA US High Yield Index Yield to Worst is currently at 7.5%8), you have had an almost 80% chance of making money over a one-year period if taking a long position9. Over three years, this rises to almost 90%10.
And in 90% of those periods in which you ended up in positive territory over three years, you would have made 3.5x as much as you lost in the periods when you ended up out of pocket11.
Simply being invested in this asset class at this point should be enough to make a decent risk-adjusted return over the medium term. But if an opportunity to add value comes “strutting, gesticulating and moonwalking” into the high-yield market – well, we think we know where to find it.
3Company reports, Bloomberg as at 29 December 2023. The index is the ICE BofA Merrill Lynch Global High Yield Constrained Index
4BofAML
5ICE BofA US High Yield Index as at 31 December 2023
6Bloomberg as at 31 January 2021
7Bloomberg, Artemis as at 31 December 2023
8As at 01/04/2024
9,10,11ICE BofA indices as at 31 December 2023