How the Artemis Corporate Bond Fund delivered five years of outperformance
Artemis’ Head of Fixed Income, Stephen Snowden, explains how exploiting the multiple inefficiencies in the investment-grade bond market have allowed the Artemis Corporate Bond Fund outperform in each of the first five years since its launch.
When I joined Artemis back in 2019, launching a new corporate bond fund was considered ‘mad’ by one wealth manager. And, to be fair, they were right. There were over 80 funds in the IA Corporate Bond sector at that time and 10-year gilt yields were less than 0.7%. Launching a new fund into a crowded market is never easy, especially as corporate bonds were not a particularly fashionable asset class back then. But I always felt that the asset class would come back into vogue.
Just as importantly, the quirks and inefficiencies of the corporate bond market means there is always scope for active managers to deliver outperformance (the growth of ETFs, whose buying and selling patterns can be predicted, is making my task progressively easier). So, in October 2019, I made the relatively easy decision, from my perspective, to launch the Artemis Corporate Bond Fund.
What I didn’t know then, of course, was that the next five years would not only bring the end of near zero interest rates and quantitative easing but also a global pandemic, war and the most painful bout of inflation since the 1970s.
The net result was that the last five years brought some of the toughest conditions for bonds – and some of the most volatile markets – I have seen in my 30-year career as an investor. How has the Artemis Corporate Bond Fund coped?
Since launch the fund has returned 8.88%, outperforming the index by 14.17%

Without wanting to be overly modest, it has coped pretty well. Our fund has produced a healthy positive return over the last five years while the index remains mired in negative territory.
From its launch on 30 October to 2019 to 31 October 2024, the Artemis Corporate Bond Fund:
- Generated a total return of 8.9% versus a decline of 0.9% in its peer group.
- Significantly outperformed the benchmark iBoxx £ Collateralized & Corporates index, which has actually fallen by 5.3% over the same timeframe.
- Outperformed the index in every discrete annual period since its launch, with the greatest margin of outperformance coming in the year between October 2021 to October 2022, which was one of the worst years for bonds in history.
| Year 1 Oct 2019-Oct 2020 |
Year 2 Oct 2020- Oct 2021 |
Year 3 Oct 2021-Oct 2022 |
Year 4 Oct 2022-Oct 2023 |
Year 5 Oct 2023-Oct 2024 |
Since launch | |
|---|---|---|---|---|---|---|
| Artemis Corporate Bond Fund | +9.08% | -0.37% | -17.43% | +3.78% | +11.1% | +8.88% |
| iBoxx £ Collateralized & Corporate Index | +4.78% | -2.95% | -21.05% | +3.35% | +9.5% | -5.82% |
| Relative | +4.10% | +2.65% | +4.69% | +0.42% | +1.6% | +14.17% |
What has been the secret to that success?
The Artemis Corporate Bond Fund has outperformed thanks to the repeated application of a simple and consistent ‘plain vanilla’ approach to investment-grade bonds…
- We haven’t used exotic derivatives or taken outsized non-benchmark positions.
- We haven’t taken any currency positions; where we have bought non-sterling denominated bonds, we have hedged the currency exposure back to sterling.
- We haven’t bought private placements (we don’t think the additional yield is sufficient compensation for the lack of liquidity).
- We haven’t held unrated bonds (we think the balance between risk and reward is unattractive). Nor have we dabbled in emerging-market credit.
- We haven’t taken outsized risks with our clients’ capital in terms of either duration or credit risk.
Focused fund
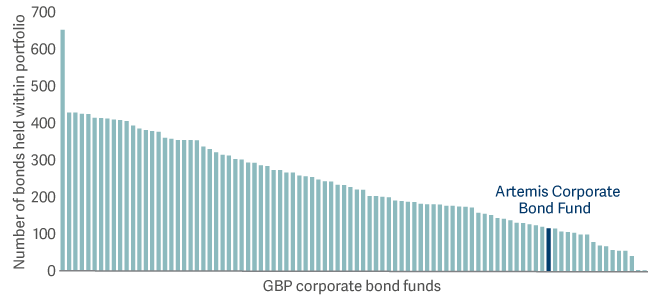
Instead, my co-manager Grace Le and I have consistently followed an active but distinctly ‘plain vanilla’ approach to exploiting the multiple inefficiencies in the sterling investment-grade bond market. Its hallmarks are:
- Managing a tight, focused portfolio: on 31 December 2024, we held positions in 113 securities versus more than a thousand in the benchmark index.
- Forming a top-down view of the outlook for yields with Artemis’ wider fixed-income team.
- Taking an active but cautious approach to duration management; we stick to a band of between -2 years and +2 years of duration relative to the index.
- Adding value by exploiting market inefficiencies. This last point is key. We actively trade within companies’ capital structures, moving between bonds of different seniority, tenor or even currency; as I hope the five brief examples below will show, we have been anything but ‘buy and hold’ investors over the last five years.
We have consistently exploited inefficiencies in the segmented corporate bond market
Because large corporations often issue multiple bonds in different currencies, of varying levels of seniority and maturities, the bond market is inherently segmented and so less efficient than the equity market. That creates opportunities for active managers who aren’t obliged to buy and sell in the way that ETFs and trackers are.
- Some funds can’t buy bonds that are denominated in certain currencies (our focus is on sterling-denominated bonds, but we have the flexibility to own euro and US dollar issues).
- Some funds can’t own bonds whose maturities are too long (or too short) to comply with their mandate.
- Some funds are too big to buy smaller issues.
- Index trackers use selective sampling.
The result is that there are multiple silos of liquidity within the investment-grade corporate bond market. And, over the last five years, we have done our best to exploit them.
Year one: Just getting started…
A good example of the type of opportunities that we try to exploit arose within months of the fund’s launch, during the early stages of the Covid pandemic.
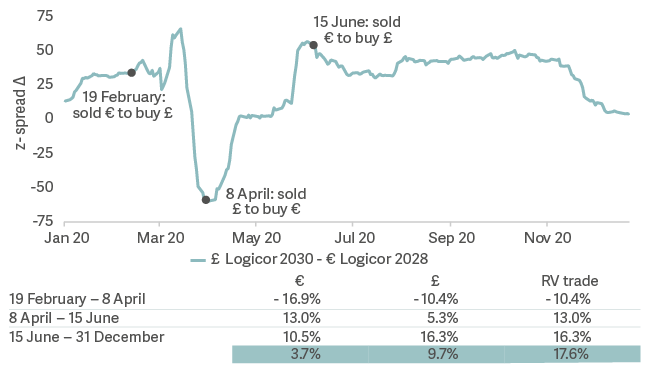
- When we launched the fund, we owned euro-denominated bonds issued by Logicor, a real estate company focused on distribution centres (Amazon is one of its largest tenants). Its euro bonds outperformed their sterling-denominated equivalents through to February 2020.
- At that point, we made a relative value switch, moving into its sterling-denominated bond. The sterling bond then outperformed through to early April, at which point we switched back into the euro bond.
- We held the euro-denominated bond through to mid-June. Once again, it outperformed the sterling bond. We then switched back into Logicor’s sterling bonds.
The risk of default in both bonds was identical. But by opportunistically switching between the two, our calculations show that we generated a return of 17.6% between mid-February and the end of 2020.
Logicor: £ - € bonds
Note: reference to specific stocks should not be taken as advice or a recommendation to invest in them.
Year two: Looking beyond the pandemic – duration management.
Look at our portfolio from the top down and you won’t see any outsized bets on duration. Today, the fund’s interest-rate risk is roughly the same as the index. Over the course of my career, I’ve seen too many corporate bond funds whose good calls on individual credits have been negated by making aggressive and incorrect calls on duration. Equally, however, managing duration is one part of our toolkit and there have been instances where we have used it – cautiously – to enhance returns.
- In December 2020, a number of Covid-19 vaccines began to receive approval. This raised the prospect of an easing of lockdowns and an economic rebound. As a team, we took the view that the gilt market was not reflecting the possibility that a burst of growth would fuel inflation. So, in late 2020, we trimmed the fund’s duration to about a year short relative to the index − the shortest it had been since launch.
- Our (relatively) short stance on duration was a significant positive over the next few months as government bonds sold off sharply.
- In an associated trade, our returns in 2021 also benefited from our decision to add exposure to bonds from companies in Covid-impacted sectors such as pubs and restaurant companies, which rebounded as the economy began to re-open. One of our strongest performing credits in 2021 was Mitchells & Butlers, the pub group.
To be clear, the fund’s duration positioning will never be the main factor determining the fund’s performance, but it can, on occasion, help to enhance returns.
Year three: Adding relative performance in a down market.
- In the third quarter of 2022, the sterling corporate bond market suffered a savage selloff, falling by 12%. This came on top of a fall of 8% in the previous quarter. The result was possibly the most painful bear market for corporate bonds I have seen in my career: the index lost 19% in 2022.
- Over this period, we adjusted the fund’s duration position tactically, running a duration position ranged between 0.5 and 1.3 years short relative to the index. In these conditions, the fund outperformed by 3%, its largest margin of quarterly outperformance to date.
- With the gilt market collapsing, we bought very long-dated gilts to close the fund’s underweight duration position. The Bank of England stepped in to stabilise the market an hour or so later, triggering a very sharp recovery. In what may be a ‘once-in-a-career’ event, we almost doubled our clients’ money in that long-dated gilt in 36 hours.
- Going into the UK’s brief experiment with ‘Trussonomics’, meanwhile, the fund had its highest-ever cash position: around 8% of its assets. We immediately re-invested this in corporate bonds as the Bank of England stepped in to restore order.
Year four: Using curve trades to generate alpha.
As we saw with Logicor, active managers can add value by shifting between similar bonds denominated in different currencies. But we can also generate returns by shifting between bonds of differing maturities: curve trades.
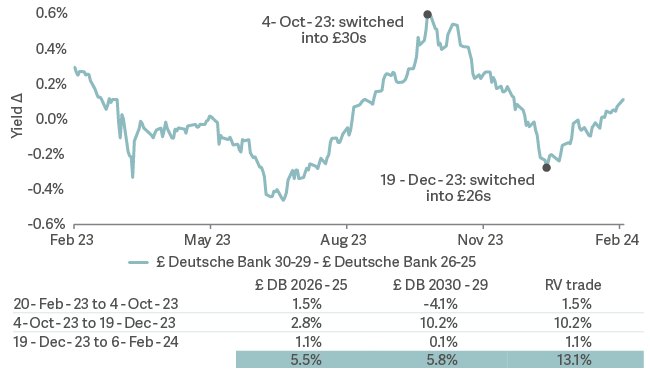
- Between February and October 2023, we held bonds from Deutsche Bank that were due to mature in 2026. As the yield curve steepened, they outperformed longer-dated issue of same seniority due mature in 2030.
- By the autumn of 2023, however, relative value pointed us in the other direction. So, we switched, moving into Deutsche Bank’s 2030 bonds. Again, we were able to generate returns without adding incremental default risk.
- Over the piece, our calculations show we generated a return of 13.1% through this relative value trade.
Switch from £ Deutsche Bank 30-29 - £ Deutsche Bank 26-25
Year five: Finding the right bonds from the right issuer.
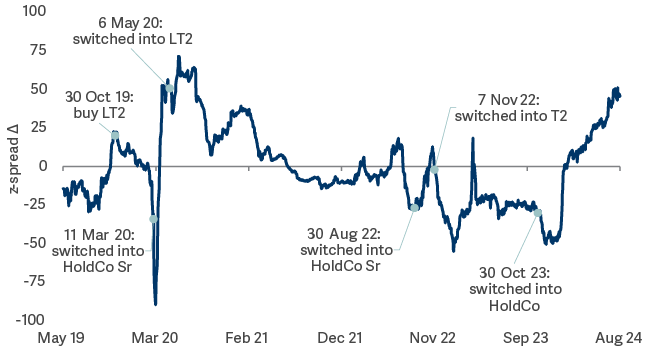
The fund has held Barclays’ bonds since launch – but not the same ones. Over the past five years, we have traded into and out of four different bonds of differing seniorities and maturities.
- At launch, we held subordinated (Lower Tier 2) bonds. As Covid gripped, ETFs became forced sellers of Barclays’ senior bonds, leading to them dramatically underperforming the (riskier) Tier 2 bonds which, being smaller, tend not to be held by passive funds. That presented us with a golden buying opportunity. So we switched, moving to a more senior part of Barclays capital structure.
- Within a few weeks, policymakers had stepped in, using QE to quell the panic. ETFs began buying back into the same senior bond they had been offloading a few weeks earlier, leading to a sudden reversal in its relative performance. We took the uplift, then switched back into the more junior bonds. The contribution to returns the fund saw on this (brief) round trip was meaningful. But the process didn’t end there…
- Over the last five years, we have continued to trade into – and out of – Barclays bonds of varying levels of seniority. Since October 2023, the fund has held Barclays’ senior 2029 bonds. That has delivered a return of 11.9% – beating any of the other Barclays’ bonds that have featured in the fund over the last five years.
£ Barclays 5.75% 2026 LT2 - £ Barclays 3% 2026 HoldCo Senior

Note: reference to specific stocks should not be taken as advice or a recommendation to invest in them.
2025 and beyond
A lot has happened over the last five years. We might all be forgiven for hoping that the next five years are slightly less dramatic. But, speaking as active bond managers, we will embrace any bouts of market volatility triggered by the actions of politicians, policymakers and by passive funds’ mechanistic, rules-based buying and selling.
Whether financial markets behave themselves or not, we believe that, by applying an active approach to the investment-grade bond market, the Artemis Corporate Bond Fund will continue to deliver a healthy margin of outperformance. I look forward to updating you on the fund’s first decade in early 2030.