Artemis Strategic Assets Fund update
David Hollis, manager of the Artemis Strategic Assets Fund, reports on the fund over the quarter to 30 June 2025.
Source for all information: Artemis as at 30 June 2025, unless otherwise stated.
Review of the quarter to 30 June 2025
The second quarter began with the announcement of 'reciprocal' US tariffs and steep declines in equities. However, given the negative reaction, US President Donald Trump delayed the implementation of these tariffs by 90 days and paved the way for the S&P 500 to end the quarter 10.8% higher (in dollar terms). This was the broad pattern for risk assets over the quarter.
Quarterly Market Returns (%)

Economic data held up well during this time, although some softening in the US labour market was evident in late June. More importantly, there was little sign that tariffs were leading to higher inflation. The Federal Reserve left interest rates on hold in anticipation that the lagged impact of tariffs would appear in the coming quarter.
The European Central Bank (ECB) reduced rates twice, although June's reduction was accompanied by a statement implying that further easing in policy was less likely given concerns about the inflationary impact of US tariffs. European risk assets were also caught up in the turmoil as Trump threatened a 50% straight tariff on the EU from 1 June, although this was delayed until 9 July, then 1 August, allowing them to end the quarter higher as well.
Fiscal concerns affected longer-dated bond yields, most notably in the US, as Moody's downgraded the country's credit rating from Aaa to Aa1. Investors were also concerned that the money raised from tariffs would not be enough to pay for the extension of tax cuts announced in the One Big Beautiful Bill Act.
Positives/negatives
The Artemis Strategic Assets Fund contains two ‘buckets’: a Directional (Trends) Strategy that aims to take advantage of market trends; and a Non-Directional Strategy, which endeavours to generate returns that are uncorrelated to market movements by taking long and short positions whose exposures offset each other. For both strategies, the fund invests in financial derivatives that provide exposure to a diversified range of asset classes, including equities, bonds and currencies.
Turning to second quarter performance, the fund declined at the start of the period, in line with risk-off sentiment following the US tariff announcement. The Directional (Trends) Strategy saw a series of long positions in euros reverse and its equity long positions also came under pressure. Within the Non-Directional Strategy, we suffered from a long euro/US dollar position and short positions in two-year Swedish and Australian rates (government bonds).
After Trump delayed the implementation of the retaliatory tariffs, risk assets recovered during May and June.
The Directional Strategy benefited from the recovery in equities and currencies in the final month of the quarter, but rates continued to drag given the lack of direction. The Non-Directional Strategy rebounded slightly, mainly driven by currencies (shorts in the Czech koruna and Norwegian krone) and equities (longs in the US and emerging market equities).
Overall, the Artemis Strategic Assets Fund lost 3.6% in the quarter compared with gains of 2.1% from its CPI+3% benchmark and 4.1% from its IA Flexible Investment sector.
| Three months | Six months | One year | Three years | Five years | |
|---|---|---|---|---|---|
| Artemis Strategic Assets | -3.6% | -4.3% | -5.5% | 13.5% | 26.0% |
| CPI +3% | 2.1% | 3.6% | 6.3% | 24.1% | 47.3% |
| IA Flexible Investment sector | 4.1% | 2.5% | 5.4% | 23.3% | 38.0% |
Activity
Directional (Trends) Strategy
- Equities: We increased our exposure from 6.9% in Q1 to 12.2% by the end of Q2, adding to long positions in equity indices once international trade-related volatility had calmed down. We have a preference for long positions in emerging Asian equity markets which benefited from a cooling in the trade war once the April reciprocal tariffs were delayed.
- Bonds: We increased duration from 2.7 years short in March to 3.7 years long in June, with a preference to be long Swiss rates which were reduced to zero during the quarter to mitigate currency appreciation. Elsewhere, the portfolio started to build longs in Australian rates where activity began slowing in June, as well as US rates for similar reasons.
Top holdings
- GBP/CAD long: The Canadian dollar has trended lower versus the pound due to negative growth fears in Canada regarding US tariffs and sticky UK inflation, which has kept domestic interest rates higher than other markets.
- Hang Seng: A stabilisation in the Chinese economy and the reinstatement of tariff negotiations with the US have lent support to the Hong Kong-based index.
- USD/MXN Short: The dollar has suffered against emerging market currencies such as the Mexican peso due to Trump's tariff war.
Non-Directional Strategy
- EUR/GBP short: We observed outflows from the euro and think it looks expensive versus the pound compared with the long-term average.
- GBP/AUD short: Positioning in the Australian dollar looks very low and the economy is, on balance, improving slightly.
- GBP/CAD long: There have been outflows from the Canadian dollar and it has relatively low yields versus other currencies, yet market positioning is relatively long.
Significant positions at quarter end
- Short CAD: While we had already established a short position in the Canadian dollar in 2024, we significantly increased its size against other G10 currencies in early March and added further to the position in June. The headwinds for the currency include outflows, overweight positioning and relatively unattractive yields (carry).
- Japanese equities: Within the Directional (Trends) Strategy, we held a long position based on prior price appreciation, although we pared this back during March as stocks rolled over. Then within our Non-Directional Strategy, we held a relative long position against other equity markets due to positive price momentum, supportive technicals and relatively cheap valuations.
- Short Japanese yen: We established a short position in the Japanese yen versus the pound relative to other G10 currencies in February and retained that position over the quarter. Relative yields are unattractive and supportive of a short, as are flows which have been very negative. Only valuation presently argues for a long position.
Since the change in fund manager, the strategy has shown a low correlation to equities, bonds and commodities, while delivering a high correlation to the cross-asset trend peer group index (BTOP50) that we are trying to capture.
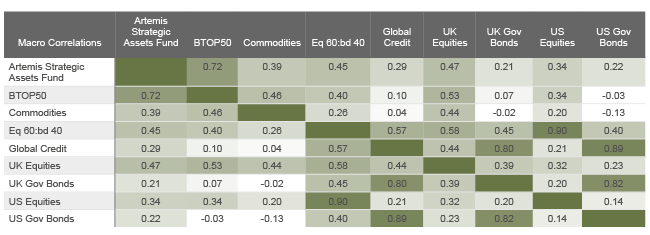
BTOP50 index replicates the overall composition of the managed futures industry (trend funds), by selection the largest investable trading advisor programs by AUM. The index components represent at least 50% of the Barclays CTA Universe by AUM.
Outlook
Tariff relief, but for how long?
Risk assets breathed a sigh of relief after reciprocal tariffs were paused for 90 days back in April. Stock markets subsequently rallied as risk appetite returned on the delay, but the deadline expires on 1 August; only then will we see how far the US has progressed in terms of reaching trade deals with its partners. Given the run-up last quarter in risk assets, markets are expecting less disruption than the April announcement, or at least a more conciliatory tone from Trump in order to avoid sending the US economy into a recession.
Nevertheless, even those countries such as the UK which enjoy a preferential relationship with the US and have an agreed trade deal framework are still incurring a 10% baseline tariff. This may be the best possible outcome for most countries. So, the prospect of higher inflation expectations and weaker growth may be diminished but not entirely eradicated through trade deal negotiations.
While bi-lateral negotiations may see tariff reductions for some countries, time is running out for most others. We believe this policy is most likely to hurt emerging market countries with large trade deficits and scant means to buy US goods.
Federal Reserve on pause for now
We are in the early phase of absorbing a wholesale change in trading relationships between the US and its trading partners. Most economists predict higher prices will be the direct result of higher trade barriers. The Federal Reserve will have to tread a fine line in setting interest rates as slower growth demands lower rates, yet inflation is still above target and the tariffs announced will likely see higher prices in the short term, if sustained.
For now, therefore, the most likely approach in setting monetary policy is for the Federal Reserve to retain rates at the current level of 4.25% to 4.5%. The president is keen to see interest rates reduced, communicating this demand regularly, and even threatening to replace the governor of the Federal Reserve before the end of his term in May 2026. At the time of writing, markets are now expecting fewer than three cuts of 0.25% this year, which would take rates down to between 3.5% and 3.75%.
Europe to continue cutting rates
Sentiment in Europe has been buoyed by Germany loosening its balanced budget rules and opening the door to significantly higher spending on infrastructure and defence. This was further boosted by the commitment to increase defence and security spending to 5% of GDP by all NATO members by 2035. However, the 2 April announcement on US tariffs came as a shock and Europe has been slow to negotiate. A lot is riding on the ability of the continent to find an amicable solution on trade, thus avoiding growth headwinds.