Artemis Funds (Lux) – SmartGARP Global Emerging Markets Equity update
The managers report on the fund over the quarter to 31 March 2024 and the outlook.
Source for all information: Artemis as at 31 March 2024, unless otherwise stated.
- The fund returned 5.4% in US dollar terms, ahead of its benchmark the MSCI Emerging Markets index, which rose 2.4%
- The fund's performance is in the top quartile vs IA GEM sector for one, three, five years and since inception
- Emerging market stocks remain cheap and unloved, with abundant growth and income opportunities.
- Value bias in the fund remains substantial, 41% discount to MSCI EM…
- …with favourable quality and growth characteristics compared to the market.
Outperformance against a rising market
Emerging market stocks rose during the quarter, albeit lagging developed market stocks. Optimism around easing of monetary policy and encouraging economic data from around the world were supportive tailwinds for stocks. With diminishing signs of recessionary concerns, particularly in the US, risk appetite seems to have improved.
Technology and cyclical areas of the market led, as traditional defensives such as healthcare and consumer staples lagged. 'Value' stocks (those that trade on below-average valuations) were not able to keep pace with the market, although they did deliver positive returns in the quarter.
The fund outperformed, despite our significant bias towards value stocks. Improved sentiment is supportive to emerging markets, given the pessimism reflected in investor positioning.
Attribution – favourable tailwinds for our holdings
A diverse group of companies contributed to performance in the quarter, reflecting several positive tailwinds developing across our holdings. Top contributors in the first quarter were Indus Towers (telecoms), CNOOC (energy), JB Financial and PKO (banks) and Lao Feng Xiang (jewellery). AI-themed stocks in Taiwan also performed well, our holdings in Wiwynn and Ennoconn featured among top contributors. On the negative side, China Medical System shares fell following weaker guidance around revenues and earnings. Elsewhere, softer commodity prices created headwinds to our positions in the sector, with Kumba Iron and Gerdau amongst detractors. Despite the setbacks, the fund delivered strong outperformance in the quarter.
Key financial metrics
| 12m forward P/E | ROE | Dividend yield | |
|---|---|---|---|
| Fund | 7.3x | 15.0% | 5.4% |
| Benchmark | 12.2x | 13.8% | 2.9% |
| Relative | -41% | 1.2% | 83% |
Activity – adding to cyclicals in Asia
Signs of a bottoming in semiconductors and the tech hardware cycle encouraged us to reduce our underweight exposure to the sector somewhat.
Additions – improving fundamental trends
- Semiconductors and electronic components – Hynix, Hon Hai and TSMC
- Cyclicals – Star Bulk Carriers, Evergreen Marine and Weichai Power
Reductions - deteriorating fundamentals
- Tech – Novatek, Lenovo, Foxconn
- Banks – Tisco and Absa Group
- Weak Q4 results – Gerdau, Ping An and Hello Group
The result of these changes is that the fund continues to offer an attractive combination of extremely low valuations and good growth prospects. We remain overweight China, Brazil and Korea and underweight India, Taiwan and Saudi Arabia. At the sector level, financials, consumer discretionary and industrials feature as the largest overweights. Materials, technology and consumer staples the largest underweights.
We remain positioned for a rotation into value stocks
The fund continues to offer an attractive combination of extremely low valuations and attractive growth prospects. The forward price/book ratio of the fund is 1 and it offers a forward P/E of 7.3 vs 12.2 for the index (a 41% discount). We think our discipline around valuations is likely to be a rewarding strategy as we progress through 2024 and for the years ahead. Typically, significant exposure to value stocks coincides with distressed balance sheets and volatile earnings. This doesn’t appear to be the case today: the fund offers favourable quality and growth characteristics. For instance, our net debt/EBITDA is significantly lower than the market and our free cash flow yield is also much higher than the market. We can achieve these compelling financial characteristics because of some behavioural biases that have caused over valuations in some parts of the market, leaving others under appreciated.
Pessimism well reflected in prices – cyclical upturn presents opportunity
For much of 2023, Chinese equity markets suffered from weaker sentiment. The Chinese economic recovery has so far been underwhelming. On the positive side, potential for stimulus measures and reasonable levels of interest rates offer support. Chinese stocks have struggled for over a decade and their share prices are well reflective of the risks highlighted. Positive catalysts such as reforms and growth initiatives have the potential to surprise investors. We have seen signs of stabilisation and believe the risk reward in China remains highly favourable
Shiller P/E by region
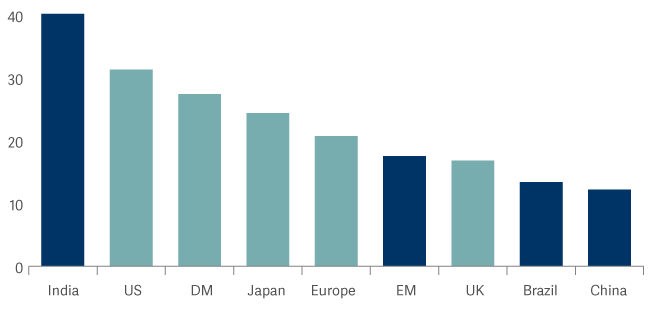
More broadly, emerging market stocks are trading on multi-decade valuation lows against developed markets across a range of metrics. Emerging market economies are ahead of the cycle and have started easing. More flexibility around monetary and fiscal policies is causing diverging paths with the west and supporting economic growth prospects ahead.
Our focus on fundamentals continues
We continue to believe that a focus on companies’ fundamentals, such as earnings and cash flow growth, combined with a strict discipline around valuations, offers the best way to navigate markets in the months ahead. Despite the last three years being very disappointing for passive EM investors, there has been no shortage of companies performing well. The compelling financial characteristics of our fund give us confidence, that regardless of the direction markets take we can continue to deliver good outcomes.
| Discrete performance, 12 months to 31 March |
2024 | 2023 | 2022 | 2021 | 2020 | 2019 | 2018 | 2017 | 2016 | 2015 |
|---|---|---|---|---|---|---|---|---|---|---|
| Artemis Funds (Lux) – SmartGARP Global Emerging Markets Equity | 16.0% | -5.3% | -3.7% | 56.5% | -20.8% | - | - | - | - | - |
| MSCI EM (Emerging Markets) NR USD | 8.2% | -10.7% | -11.4% | 58.4% | -17.7% | - | - | - | - | - |
Source: Lipper Limited/Artemis from 31 December 2023 to 31 March 2024 for class I Acc USD
All figures show total returns with dividends and/or income reinvested, net of all charges.
Performance does not take account of any costs incurred when investors buy or sell the fund.
Returns may vary as a result of currency fluctuations if the investor's currency is different to that of the class.
Benchmark: MSCI Emerging Markets Index; the benchmark is a point of reference against which the performance of the fund may be measured. Management of the fund is not restricted by this benchmark. The deviation from the benchmark may be significant and the portfolio of the fund may at times bear little or no resemblance to its benchmark.