Emerging markets: key questions from investors
Chinese stimulus has sparked renewed interest in emerging markets. Raheel Altaf, manager of the Artemis SmartGARP Global Emerging Markets Equity Fund, addresses some key questions.
Why is now a good entry point for emerging markets?
Relative valuations
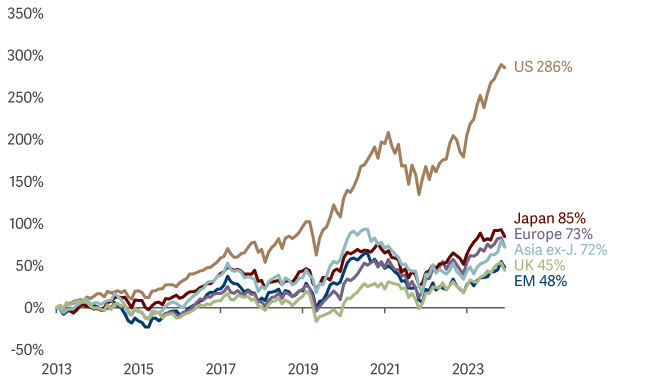
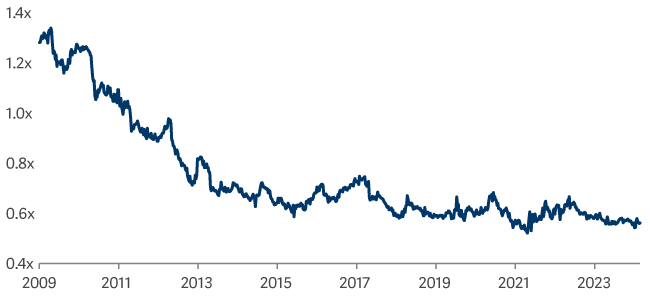
Emerging market equities have lagged global equity markets for some time. As a result, they are now trading at attractive relative valuations, as evidenced by the Shiller P/E (a long-term measure of valuations1).
Relative performance of major equity markets
Shiller P/E - EM vs S&P 500
Within emerging markets, China, Brazil, Indonesia, Turkey and Korea are particularly cheap versus history, and so are reflecting a lot of bad news and pessimism already. Our view is that the best determinant for long-term returns is starting valuations – and these are certainly looking attractive in emerging markets.
Strength of the emerging market consumer
Over the last decade or more, many emerging markets have gained in resilience and self-sufficiency. This is largely due to the strength of the emerging market consumer, as domestic consumption is driving the underlying economies. Whereas in the past you might have bought a Western company to gain access to these changes in consumption, there is now a broad range of very high-quality domestic companies serving those new trends. This makes investing in emerging markets a real diversifier.
Monetary policy
Emerging market central banks were well ahead of the curve in raising interest rate, and therefore stifling inflation, leaving these economies with some of the highest real yields globally. This now gives these economies the ability to ease at a faster rate than developed economies which should be supportive to their equity markets.
Supply chains
A lot of attention has been focused on restrictions in supply chains and the shift away from China. But the biggest beneficiaries of that shift are other emerging market economies: India, Vietnam, Indonesia, Poland and Mexico have all benefited from global supply chains starting to shift. Emerging market economies continue to have young cheaper labour forces to support this activity. This is likely to continue to boost economic growth in the future.
All of this creates opportunities…
When times are bad, risk aversion can lead to indiscriminate selling. We believe this creates opportunities for disciplined investors and our process has been designed to look for the companies where the fundamentals are signalling good news, yet share prices are not reflecting this optimism.
How are you positioned in China? Has the threat of tariffs from the US changed your view?
During his campaign, Trump had flagged imposing tariffs of up to 60% on Chinese imports into the US, continuing the protectionist measures introduced in his first term. It remains to be seen if this will become substantive policy or was merely campaign rhetoric.
The important point, however, is this: policymakers in Beijing aren’t standing idly by while external risks escalate. Worries about tariffs and protectionist measures are not new for China and much appears to be reflected in lower prices.
In September 2024, the Chinese government issued a series of stimulus announcements, making it clear that it is willing to support the economy with significant and co-ordinated moves. Following Trump’s landslide victory in November, the Chinese government announced a further stimulus package, worth $1.4 trillion2.
Our positioning
The fund has been overweight China for several years, with a bias towards value stocks. Negative sentiment had depressed share prices in very attractive companies, including banks, energy companies and state-owned enterprises. Our allocation to China outperformed despite the overall weakness in the market.
In the last few months, before the stimulus announcement, pessimism reached extreme levels and with low investor positioning we felt the risk/reward payoff had become extremely favourable and increased the fund’s position in China. There is a clear disconnect between share prices and financial performance of businesses in the region. As investors remain sceptical about conditions in the economy improving, we believe a disciplined value approach can help unearth great opportunities.
Recent purchases include e-commerce companies Alibaba and JD.com. Not long ago, these were consumer ‘darlings’ and acted as mainstays of many GEM investors' portfolios – today they are heavily out of favour. Yet, in both instances we are seeing catalysts for recovery. Both companies have superior cash generation and attractive shareholder return policies. We have also added to our positions in Geely (parent company to Volvo) and drug producer Sino Biopharmaceutical among others.
Renewed optimism towards the market should create a favourable support for these positions in future months, yet it will no doubt be a volatile journey. Our preference for value stocks means that the margin of safety reflected in our China holdings' valuations is significant, should the market see another setback.
Are emerging markets attractive for income investors?
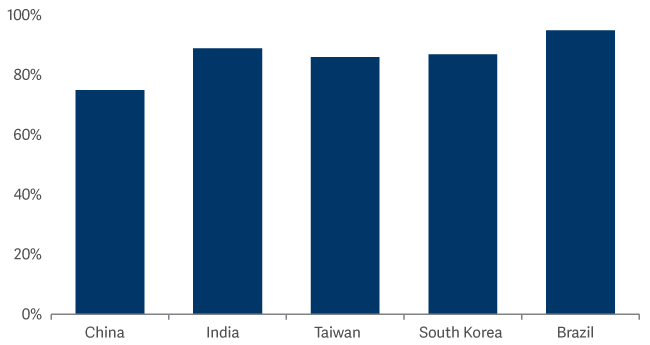
While perhaps traditionally associated with growth investing, emerging market equities also offer attractive income opportunities. As Chart 3 illustrates, there are plenty of dividend-paying companies to choose from.
Top 5 EM countries (% of stocks paying dividends)
In addition, a number of emerging markets have undertaken reforms to become more shareholder friendly. In the case of China and Korea, they have been following Japan’s lead over recent years by instigating share buy backs, reducing cash balances and increasing dividend payouts. This means that some markets offer an interesting share buy-back yield as well as a dividend yield.
While the overall yield on the index is around 3%, some good-quality companies have double-digit yields. Banco do Brasil, for example, offers a dividend yield of 10.2%3. South African Nedbank has a dividend yield of 7.9% and a buyback yield of 4.6%4.
Emerging markets: attractive combination of growth & income (artemisfunds.com)
What is your overall positioning?
As mentioned above, we have had an overweight position in China for some time. Alongside our China overweight, in aggregate we are overweight Brazil, Korea and UAE and underweight India, Taiwan and Saudi Arabia.
While we mentioned above the overall attractive valuations that EM equities are trading at, it is also interesting to note that India is the most expensive market in the world in Shiller PE terms.
Shiller P/E by region
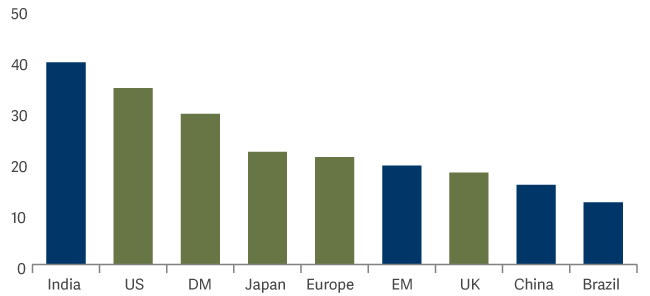
We find many areas in India excessively valued, but still have substantial holdings in cheaper areas of the market.
In terms of sectors, financials, consumer discretionary, utilities and industrials feature as the largest overweights. Materials, technology and consumer staples are the largest underweights.
We remain heavily biased towards value stocks. The fund offers a forward P/E of 7.7 vs 12.4 for the index (a 38% discount)5. We think our discipline around valuations is likely to be a rewarding strategy for the years ahead. Whilst value stocks in EM have recovered from depressed levels in recent years, the gap in valuations between cheap and expensive stocks remains stretched. This suggests there is still an opportunity. Typically, significant exposure to value stocks coincides with distressed balance sheets and volatile earnings. This doesn’t appear to be the case today, the fund offers favourable quality and growth characteristics. For instance, our net debt/EBITDA is low, and our free cash flow yield is much higher than the market.
2 Reuters