What is SmartGARP telling us at the moment about share prices?
Philip Wolstencroft, manager of the Artemis SmartGARP European Equity Fund, observes that over the long term, share prices follow the direction of companies’ profits. His investment approach is currently signalling value in European equities.
As investment managers, we are primarily concerned with a simple question: ‘what makes share prices go up and down?’ Over many years, we have observed that, although short-term price movements are random, in the long-term share prices follow the direction of companies’ profits.
We can see this reflected in the overall market over the last 50 years…
Global stock market over 50 years
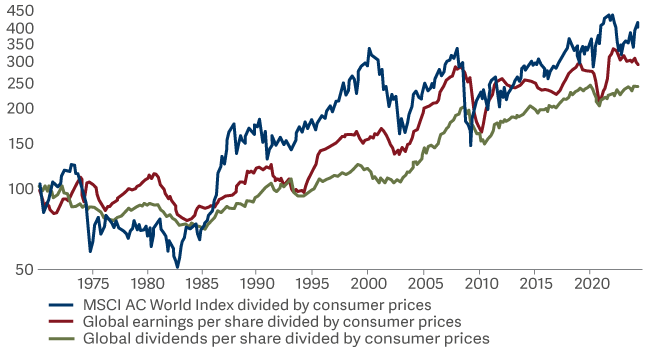
The chart shows the performance of the global stock market (using the MSCI AC World Index in real terms) over the past 50 years, compared to the performance of earnings per share and dividends. While at times of particular optimism or pessimism (such as the tech bubble or the Global Financial Crisis) share price performance is exaggerated on the positive or negative side, over the long term, as this chart demonstrates, prices broadly follow earnings.
Currently share prices in aggregate look a bit extended given the slippage in real profits. However as active managers we do not buy the index – we try to own stocks that are undervalued and seeing growth. Over more than 20 years, we have been using our proprietary tool, SmartGARP, to steer us in the right direction.
What makes share prices go up and down?
For more than a decade US markets have been leading markets upwards both in share price terms and profits. As the saying goes ‘The US innovates, China replicates and Europe regulates’. SmartGARP understands the sentiment but thinks parts of Europe are less of a disaster area than current prices anticipate.
European Equities vs US Equities
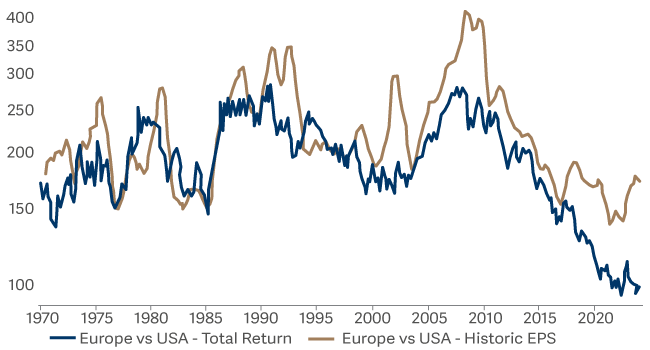
European share prices are low (particularly compared to the US) because the market expects relative earnings (the gold line above) to continue the trend of the past decade and fall further. But recently earnings have moved up slightly. As the European market is trading on about 60% of the US’s price earnings ratio (15x vs 26x), buying European equities looks to be a relatively low-risk trade.
However, we do not want to buy stocks where a lot is discounted but not much is likely to be delivered, so we are of course selective.
Whereas in the US the good news is very much focussed on growth stocks, in Europe it is the value stocks (those that trade on below-average valuations) that are growing profits. Indeed, European value stocks in aggregate are seeing good EPS growth not just amongst the European universe but also versus the US market in general – growth that is not (yet) being reflected in share prices:
MSCI Europe Value vs MSCI US
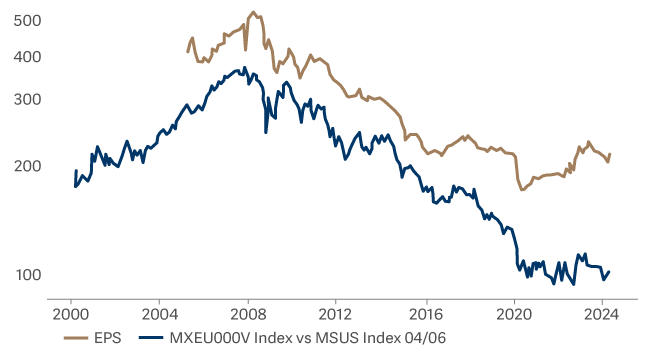
Looking at chart, earnings for European value stocks are trending up, but they are trading on half the US’ price earnings ratio. Meanwhile, our European fund trades on even lower multiples and is seeing decent growth on a relative basis.
SmartGARP Europe Fund vs FTSE Europe ex UK
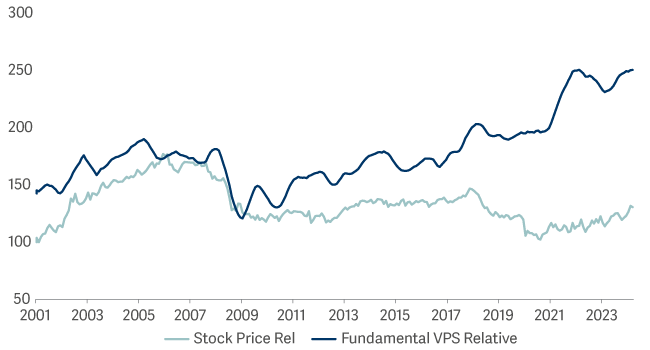
In this instance the dark blue line is a combined measure of earnings, cash flow, operating profits, dividends and asset value per share.
What it illustrates is that the SmartGARP Europe fund has had over 23 years of having a combination of income and growth that is 2-3% better than the market. It is not that we had a great insight into the future and predicted strong growers. Rather we have a process that steers us towards stocks which end up with above-average characteristics.
Nevertheless, prices have lagged fundamentals and the gap is wide now. We expect the gap to narrow, not by the fundamentals deteriorating but rather by the relative share price return heading up. In effect, the stocks we own seem to have fewer of the risks of markets in general and more of the opportunities.