Artemis SmartGARP UK Equity Fund update
Philip Wolstencroft, manager of the Artemis SmartGARP UK Equity Fund, reports on the fund over the quarter to 30 September 2024.
Source for all information: Artemis as at 30 September 2024, unless otherwise stated.
Fund objective
The fund’s objective is to seek long-term capital growth by investing in attractively-valued companies whose earnings are growing, mainly in the UK.
Summary
- Our fund has a winning quarter and year.
- Active Funds continue to suffer and haemorrhage.
- Our alpha is no accident.
The Artemis SmartGARP UK equity fund had a good quarter and a good year. It is up 5.2% on the quarter and 18.8% year to date respectively while the FTSE All Share returned 2.3% and 13.4%. This appeared to make us the 12th best performing fund (of the largest 110 UK active equity funds) and the 13th best in terms of net inflows (a heady +£6m). For context, the 13th worst on net flows saw an outflow of £360m.
| Three months | Six months | One year | Three years | Five years | |
|---|---|---|---|---|---|
| Artemis SmartGARP UK Equity Fund | 5.2% | 5.5% | 18.8% | 32.1% | 69.6% |
| FTSE All-Share TR | 2.3% | 6.1% | 13.4% | 23.9% | 32.2% |
| IA UK All Companies Average | 2.3% | 6.3% | 14.2% | 8.5% | 24.9% |
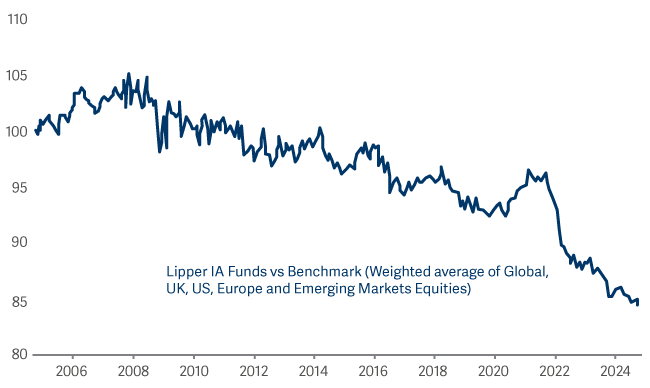
While it is more relevant for fund management companies than clients, the flow of money into and out of equity mutual (and unit trust) funds around the world is instructive. Money is flowing from active managers to passive managers. For context, in the past 12 months passive equity funds around the world have seen net inflows equivalent to 3% of their assets. Active funds have seen net outflows of 4.4% of assets. This reflects the relative performance of active funds. Chart 1 shows a proxy for the performance of UK domiciled funds versus their benchmarks (the trend is worse outside of the UK). The downward lurch in 2022 reflects the fact that most active funds had by this stage taken a negative stance towards value investing. The sharp eyed amongst you will note that being down 15% over 20 years is something like 0.8% per annum – which is probably about the same as the average fee charged for a unit trust. So, management fees + average returns = underperformance.
Equity Funds vs Benchmark

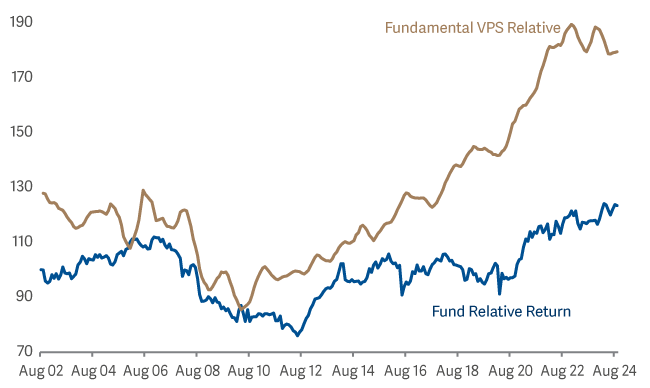
Obviously to survive funds have to deliver “alpha”. I think we deliver that. Over the past 22 years that Artemis has been running this fund (me since 2010) the fund is up 23.5% against the benchmark (or about +1% pa). No doubt a sceptic would argue that we could have got lucky with our darts throwing and that investors should stick to index funds. I believe that our outperformance is because our fund has owned stocks that over the years have delivered a combination of good income and above average growth. This I put down to our stock picking process – SmartGarp. The chart below illustrates the performance of the Artemis SmartGARP UK equity fund vs the All Share – both in terms of performance (what clients are interested in) and in terms of the underlying performance of the business that we have owned (what I am interested in). My belief is that if you own companies that subsequently grow faster than the market (gold line up), share prices will follow (blue line up) and we will all be happy.
SmartGARP UK vs All Share

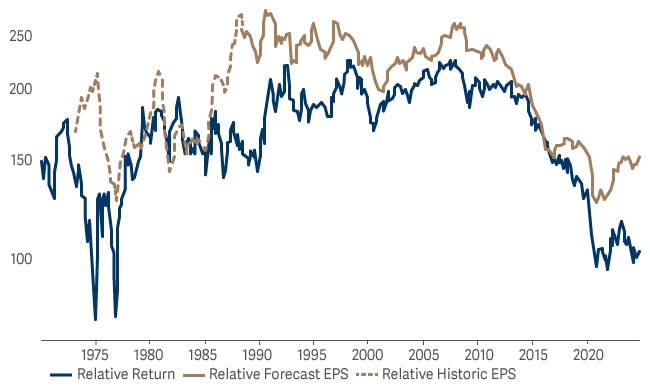
MSCI UK vs MSCI World

UK equities are cheap and (somewhat unexpectedly) delivering similar or better EPS growth than global equities. At some point investor sentiment will improve, money will flow into UK equities and maybe even into this fund! Meanwhile I think this fund will continue to deliver good returns for our clients.

