Artemis SmartGARP UK Equity Fund update
Philip Wolstencroft, manager of the Artemis SmartGARP UK Equity Fund, reports on the fund over the quarter to 30 June 2025.
Source for all information: Artemis as at 30 June 2025, unless otherwise stated.
Review of the quarter to 30 June 2025
The Artemis SmartGARP UK Equity Fund had a good quarter – up 12.5% while the benchmark was up 4.4%. This represents a continuation of a long-term trend of outperformance. In the past decade, the fund has returned 10.4% per annum after fees – some way ahead of the 6.8% figure from the FTSE All-Share. The outperformance contrasts with most UK unit trusts, which have lagged the market. Our strong performance over the years is not unrelated to the strong earnings-per-share (EPS) growth of the stocks we have owned.
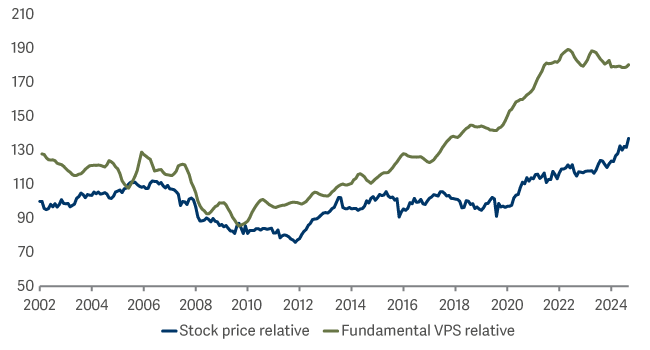
SmartGARP UK vs All Share

The fund's prospective price-to-earnings (P/E) ratio is currently 8.9, compared with 14.9 for the FTSE All-Share. There is a tendency to assume that stocks on a low P/E will subsequently increase their EPS more slowly than the market. This may be true for value stocks in general, but not in our case. Our value stocks have tended to increase their EPS and dividends per share (DPS) by about 2 percentage points per annum ahead of the FTSE All-Share.
While the gap between the two lines in the chart above can widen and narrow from time to time, they tend to track one another. Fundamentals matter. This gap, having been abnormally wide for a few years, has narrowed to more normal levels recently (our stocks were very cheap, now they are just cheap). This is why our performance has been so strong over the past couple of years.
| Three months | Six months | One year | Three years | Five years | |
|---|---|---|---|---|---|
| Artemis SmartGARP UK Equity Fund | 12.5% | 16.9% | 31.7% | 66.3% | 144.4% |
| FTSE All-Share TR | 4.4% | 9.1% | 11.2% | 35.5% | 67.3% |
| IA UK All Companies Average | 7.5% | 7.4% | 8.5% | 29.4% | 50.8% |
The dominant theme during the quarter was the US government attempting to pick a fight with pretty much everyone outside of the US. US equities need global co-operation (on rules, taxes and so on), but tariffs make this less likely. Commentary tends to focus on winners and losers from tariffs, when in reality, the chart below illustrates who the real loser is likely to be – anyone who invests in US equities.
Contributors/detractors
The fund’s biggest sector tilt is to banks at 23.3%, compared with only 13.5% from the FTSE All-Share. With interest rates coming down, some investors may assume that bank profits are about to shrink and so question our position. We tend to focus on changes in EPS forecasts as a proxy for whether things are deteriorating or improving. In the past few months, while the market’s EPS forecast has come down by almost 1%, UK banks’ estimates have risen by nearly 3% – so we are inclined to give them the benefit of the doubt.
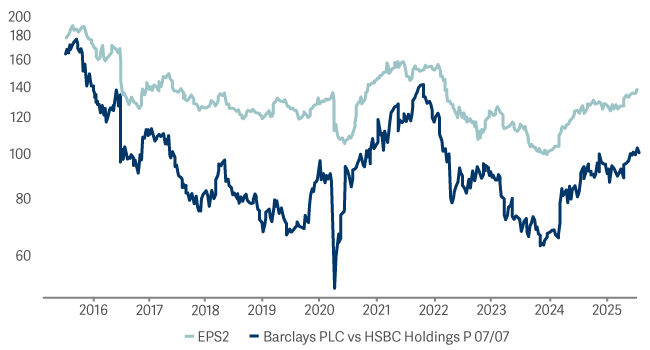
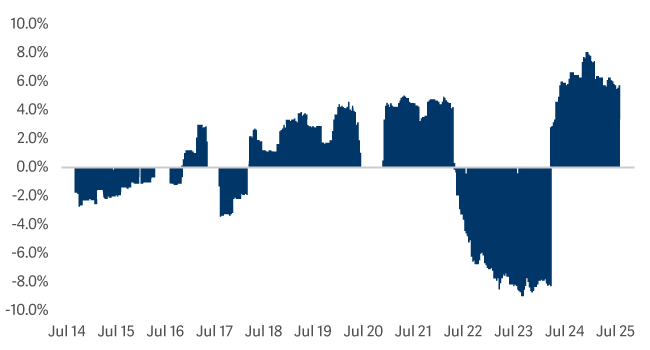
What is more, the bulk of our outperformance tends to come from stockpicking rather than sector allocation. As an illustration, HSBC and Barclays are the two largest companies in the UK banking sector. Over the past decade we have tended to own either one or the other, but rarely both. For example, we had nothing in Barclays from July 2022 to February 2024 and an average of 7.5% of the fund in HSBC. Since then, we have averaged 6.8% in Barclays and 0.8% in HSBC. We switched the positions around because SmartGARP changed its relative preference. The trigger came on the back of company results and subsequent revisions to profit forecasts.
EPS vs relative performance of Barclays and HSBC

Barclays minus HSBC Position

As the top chart shows, Barclays outperforms HSBC when the relative EPS moves up and vice versa. The bottom chart shows that our fund responds to this news and that sometimes it loves HSBC whereas at other times it prefers Barclays. For the past couple of years it has loved Barclays, which has worked out well.
Indeed, the banks have been among the biggest contributors to performance in the past few months – primarily via owning Lion Finance and Barclays rather than the sector in general.
There were few major detractors during the period, although our holdings in oil & gas stocks Equinor and TGS worked against us as energy prices fell.
Activity
As ever, we adjust the constituents of the fund as new information becomes available. In the past few months, we have sold our holdings in Tesco and J Sainsbury (price competition led to downgrades). We also reduced our exposure to Marks & Spencer and Shell (again, following downgrades).
We made purchases in Lloyds Bank, United Utilities, NatWest, IG Group and M&G. This kept our exposure to value stocks more or less unchanged but ensured we remained focused on upgrade stocks. In doing this, we should increase the probability that our fund's EPS continues to outpace that of the market.
In owning lowly valued stocks that are growing, the fund should continue to deliver superior returns for our clients.
Outlook
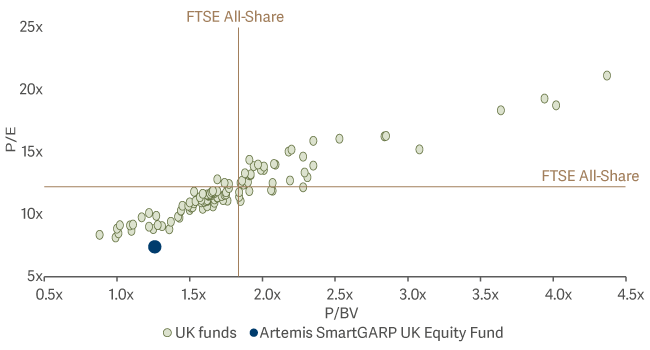
Despite our emphasis on owning companies that are growing faster than the market, we have somehow ended up with the lowest P/E ratio of any fund in the IA UK All Companies sector, according to Morningstar. This shouldn’t be happening: by definition, deep-value investors should have cheaper portfolios than us. But here’s the thing: in this sector, there do not appear to be any left. It would seem that value investors experienced so much pain during the post-Global Financial Crisis era that they were either fired or retired.
SmartGARP UK: Significant value bias to peers

Aside from having a higher value exposure than everyone else, our tilt is also close to extreme highs compared with our own historical levels. But perhaps ‘extreme’ is the wrong word – in our view it is perfectly rational to skew our portfolio towards value while these stocks look desperately cheap; instead, it is the investors who have paid well over the odds to hold ‘growth’ stocks that are taking an extreme position.
While growth-at-any-price strategies worked well during the period of ultra-low interest rates, those days are now over and don’t look as if they are coming back anytime soon. It is time to adjust to the new environment.

